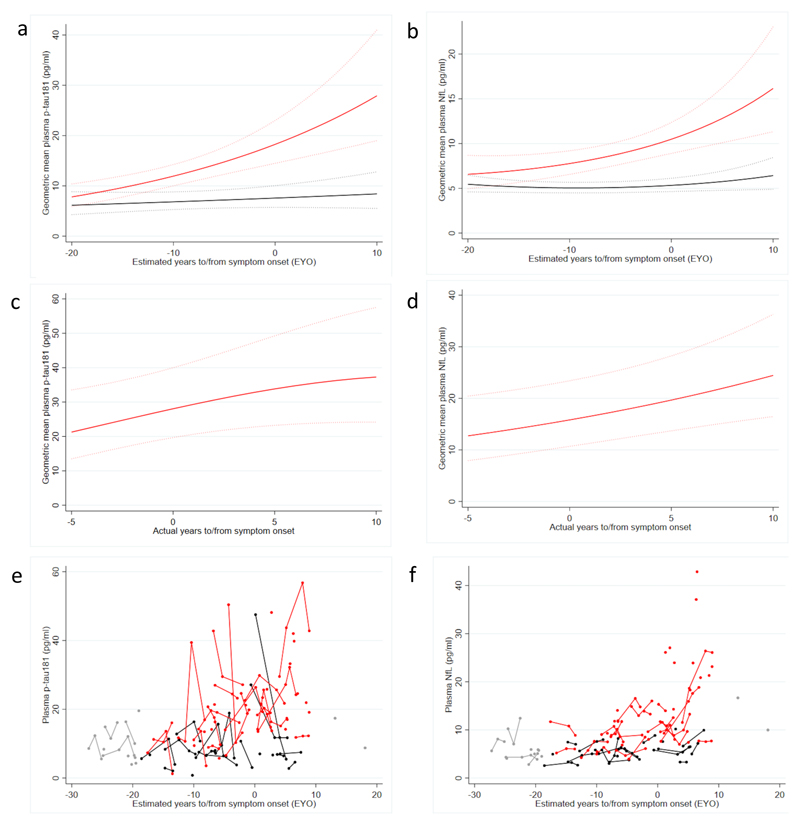
Figure 3. Trajectory of plasma biomarkers against estimated and actual years to/from onset.
Mutation carriers represented in red; non-carriers in black. Modelled changes in geometric mean plasma p-tau181 (a) and plasma NfL (b), for a hypothetical female aged 38·1 years (the average age of non-carriers), against estimated years to/from onset. Modelled changes in geometric mean plasma p-tau181 (c) and plasma NfL (d) against actual years to/from symptom onset for a hypothetical female carrier aged 38·1. There were 24 symptomatic subjects where actual age at onset was known, 19 of whom were already symptomatic at time of first plasma sampling and five subjects who became symptomatic after their baseline sample; for three of these plasma sampling took place before and after symptom onset. Dotted lines indicate 95% confidence intervals (a-d). Observed plasma p-tau181(e) and plasma NfL(e) concentrations against estimated years to/from symptom onset. To preserve blinding to genetic status of all observed values for timepoints more than 19 years before expected symptom onset and more than 10 years after expected symptom onset are shown in grey; some timepoints have been removed for at risk individuals who could be identified by their number of visits.

