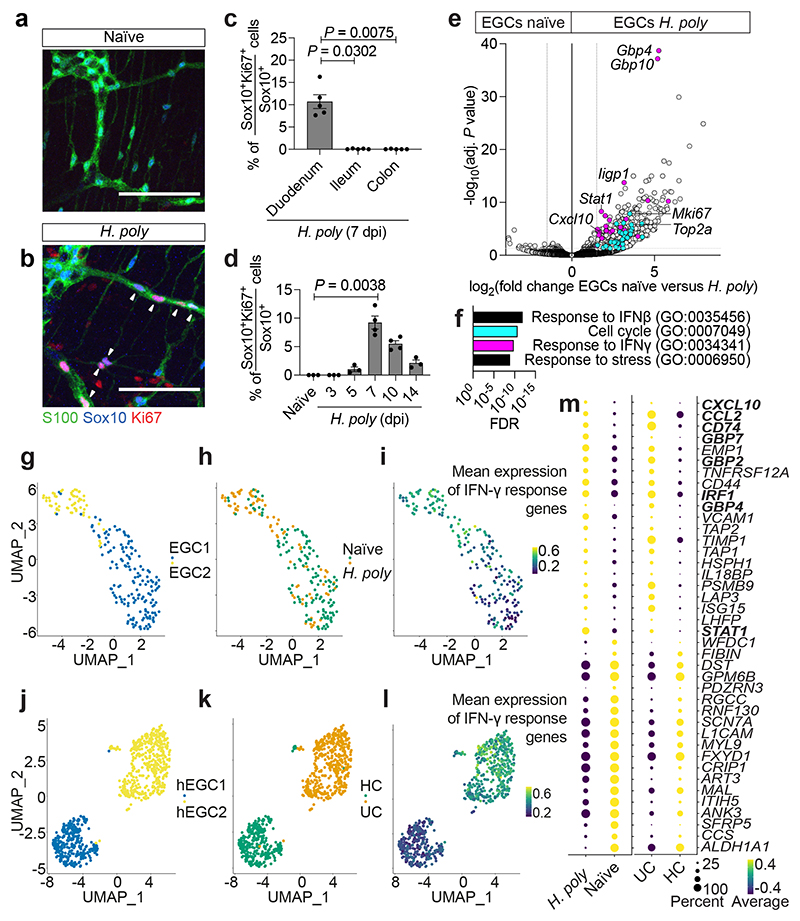
Figure 1. Inflammatory injury induces IFN-γ signature in EGCs.
(a, b) TM preparations from the duodenum of naïve (a) and H. poly-infected (b) animals (7 dpi) immunostained for S100, Sox10 and Ki67. Arrowheads: Ki67+ EGCs. (c) Quantification of Ki67+ EGCs in the duodenum, ileum and colon of H. poly-infected animals (n=4). (d) Time-course analysis of EGC-proliferation after H. poly infection (nnaïve,3dpi,5dpi,14dpi= 3, n7dpi,10dpi= 4, data from one experiment, data at 7 dpi representative of 3 experiments). (e) Volcano plot showing mean log2-transformed fold change and significance (-log10(adjusted P value)) of differentially expressed genes in tdT+ cells from naïve and H. poly-infected Sox10|tdT animals (7 dpi). Coloured dots: genes associated with the GO terms “cell cycle” (turquoise) and “response to IFN-γ” (magenta). n=4. (f) Top GO terms associated with the differentially expressed genes in EGCs from H. poly infected mice. “Cell cycle” and “response to IFN-γ” terms colours correspond to colour of genes highlighted in (g). (g-l) UMAP of sequenced EGCs from the TM of naïve and H. poly infected mice (g-i) or human healthy colon (HC) and Ulcerative Colitis colon (UC) (j-l) (human dataset, GSE114374 8 ). Cells are color-coded according to Louvain clusters (g, j), experimental (h) or disease condition (k) and mean scaled expression of IFN-γ response-associated genes (i, l; selection based on GO term “response to IFN-γ”). (m) Intersection of genes differentially expressed by mouse (left, naïve versus H. poly-infected mice) and human (right, HC versus UC patients) EGCs. Bold: IFN-γ-target genes. Kruskal-Wallis test (c, d). Mean±SEM (c, d). Scale bars: 100 μm

