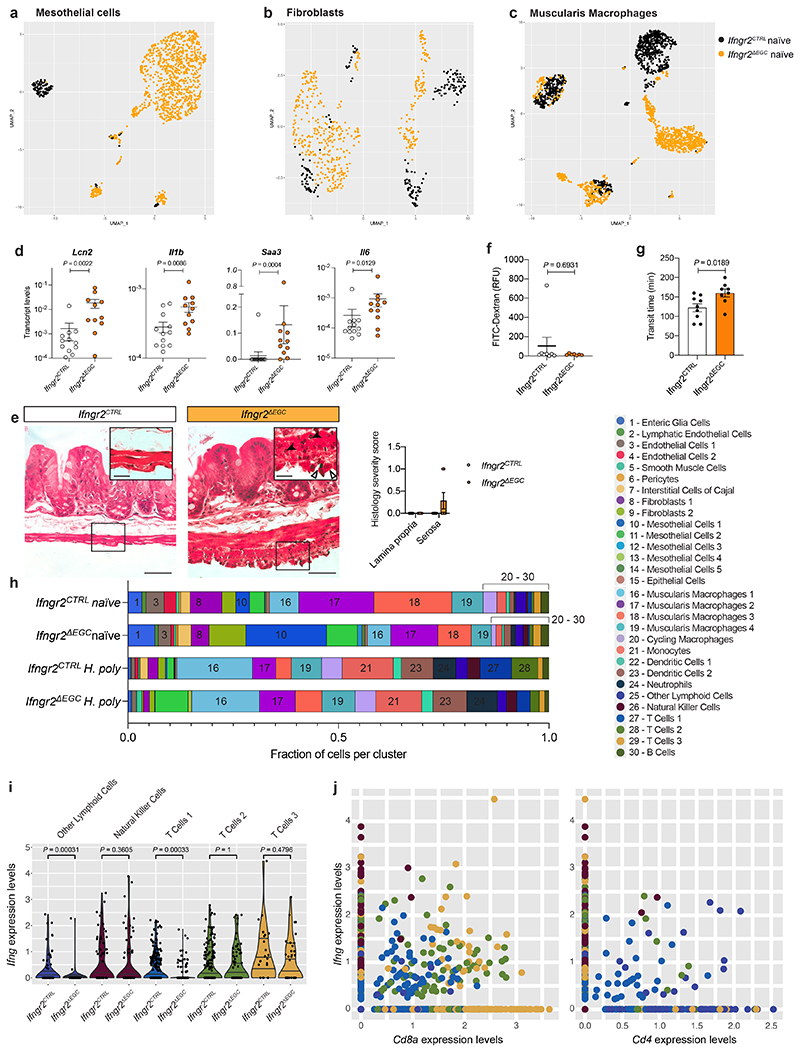
Extended Data Figure 6. Glia-specific ablation of IFN-γ signalling induces a tissue-wide pro-inflammatory state of TM at steady state and modulates the response to H. poly infection.
(a-c) UMAP representation of mesothelial cells (a), fibroblasts (b) and muscularis macrophages (c) from naïve Ifngr2CTRL (black) and Ifngr2ΔEGC (orange) mice. (d) qRT-PCR analysis of Lcn2, Il1b, Saa3 and Il6 transcript levels in the TM from naïve Ifngr2CTRL and Ifngr2ΔEGC mice. nCTRL=12, nΔEGC=11. (e) Representative H&E stained intestinal cross-sections from naïve Ifngr2CTRL and Ifngr2ΔEGC mice. Empty and filled arrowheads in inset highlight reactive mesothelial cells and eosinophils, respectively. Scale bars = 50 μm, insets: 20 μm. Shown also is histology severity score (right) assessing inflammation in the lamina propria and tunica muscularis from naïve Ifngr2CTRL and Ifngr2ΔEGC mice. n=8. 2 experiments. (f) Intestinal paracellular permeability in naïve Ifngr2CTRL and Ifngr2ΔEGC mice. nCTRL=8, nΔEGC=7 (2 independent experiments). (g) Whole intestinal transit time in naïveIfngr2CTRL and Ifngr2ΔEGC mice. nCTRL=9, nΔEGC=8. (h) Fraction of cells per cluster in naïve and H. poly-infected Ifngr2CTRL and Ifngr2ΔEGC mice. (i) Violin plot visualisation of Ifng expression levels per single cell in indicated cell clusters. (j) Dot plot quantification of expression levels of Ifng vs Cd8a (left panel) and Ifng vs Cd4 (right panel) in the Other lymphoid cells, NK cells, T Cells 1, T Cells 2 and T Cells 3 clusters, indicating that Cd8a T cells are a major source of Ifng in the TM of H. poly-infected mice at 7 dpi. Two-tailed Mann-Whitney test (d, f). Unpaired two-tailed t-test (g). Mean±SEM.

