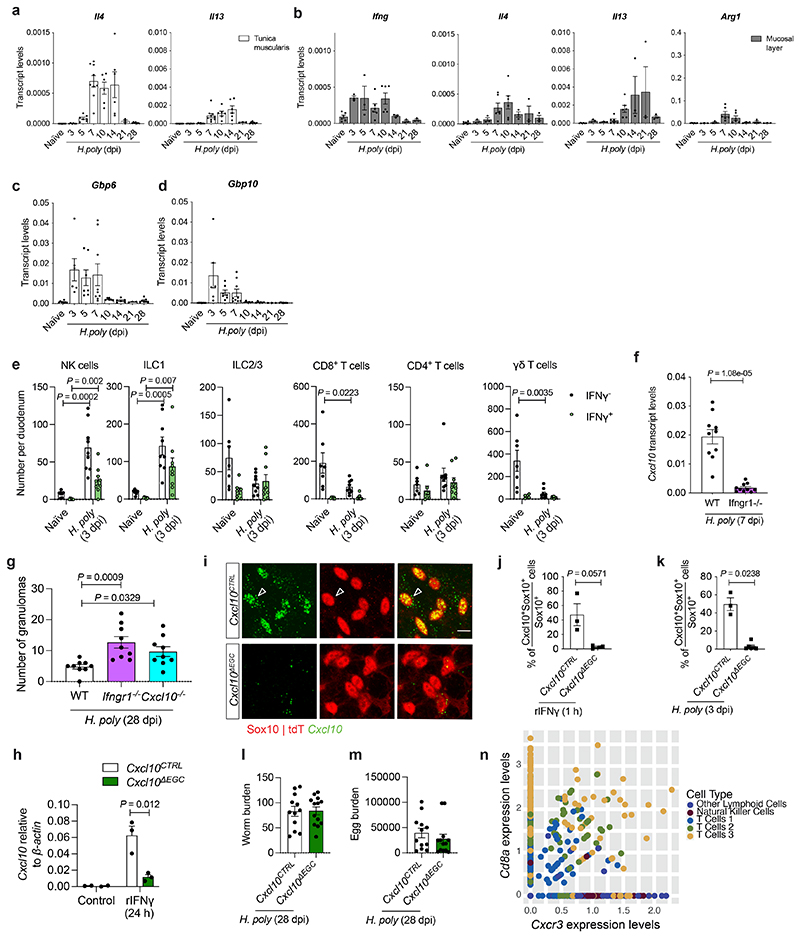
Extended Data Figure 7. Activation of the IFN-γ-Cxcl10 axis in TM precedes type II immune response and promotes tissue repair after helminth infection.
(a, b) qRT-PCR analysis of Il4 and Il13 transcripts in TM (a; nnaïve=8, n3dpi,7dpi,10dpi,14dpi=6, n5dpi,28dpi=7, n21dpi=3) and Ifng, Il4, Il13 and Arg1 transcripts in mucosa (b; nnaïve,7dpi,10dpi=6, n3dpi,5dpi,14dpi,21dpi,28dpi=3) of small intestine following H. poly infection. 2 experiments. (c, d) qRT-PCR time-course analysis of Gbp6 (c) and Gbp10 (d) transcript levels in TM after H. poly infection.nnaïve=8, n3 dpi,7 dpi,10 dpi,14 dpi=6, n5 dpi,28 dpi=7, n21 dpi=3. 2 experiments. (e) Flow cytometric quantification of IFN-γ-producing cells in the TM of H. poly-infected WT mice (3 dpi). nnaïve=7, n3dpi=9. 2 experiments. (f) qRT-PCR analysis of Cxcl10 transcripts in TM from H. poly-infected (7 dpi) WT and Ifngr1 -/- mice. n=10. 2 experiments. (g) Quantification of granulomas in the small intestine H. poly-infected (28 dpi) Ifngr1 -/- and Cxcl10 -/- mice. n=9. 2 experiments. (h) qRT-PCR analysis of Cxcl10 transcripts from rIFN-γ-treated cultures (24 hours) of EGCs from Cxcl10CTRL and Cxcl10ΔEGC mice. nControl=2, nrIFN-γ=3. (i) In situ hybridization for Cxcl10 in IFN-γ-treated (1 hour) myenteric plexus from the duodenum of Cxcl10CTRL and Cxcl10ΔEGC mice. Cxcl10+ EGCs indicated by empty arrowhead. Scale bar = 10 μm. (j) Quantification of Cxcl10+ EGCs in IFN-γ-treated (1 hour) TM preparations from Cxcl10CTRL and Cxcl10ΔEGC mice. nCTRL=3, nΔEGC=4. (k) Quantification of Cxcl10+ EGCs in the TM of H. poly-infected Cxcl10CTRL and Cxcl10ΔEGC mice (3 dpi). nCTRL =3, nΔEGC=6. (l, m) Quantification of adult worms (l) and eggs (m) in small intestine from H. poly-infected Cxcl10CTRL and Cxcl10ΔEGC mice (28 dpi). nCTRL=12, nΔEGC=13. 2 experiments. (n) Dot plot analysis of Cxcr3 vs Cd8a expression indicating that Cd8+ T cells in TM express Cxcr3. Two-tailed Mann-Whitney test (f, j, k). Kruskal-Wallis test (g). Unpaired two-tailed t-test (e, h). Mean±SEM.

