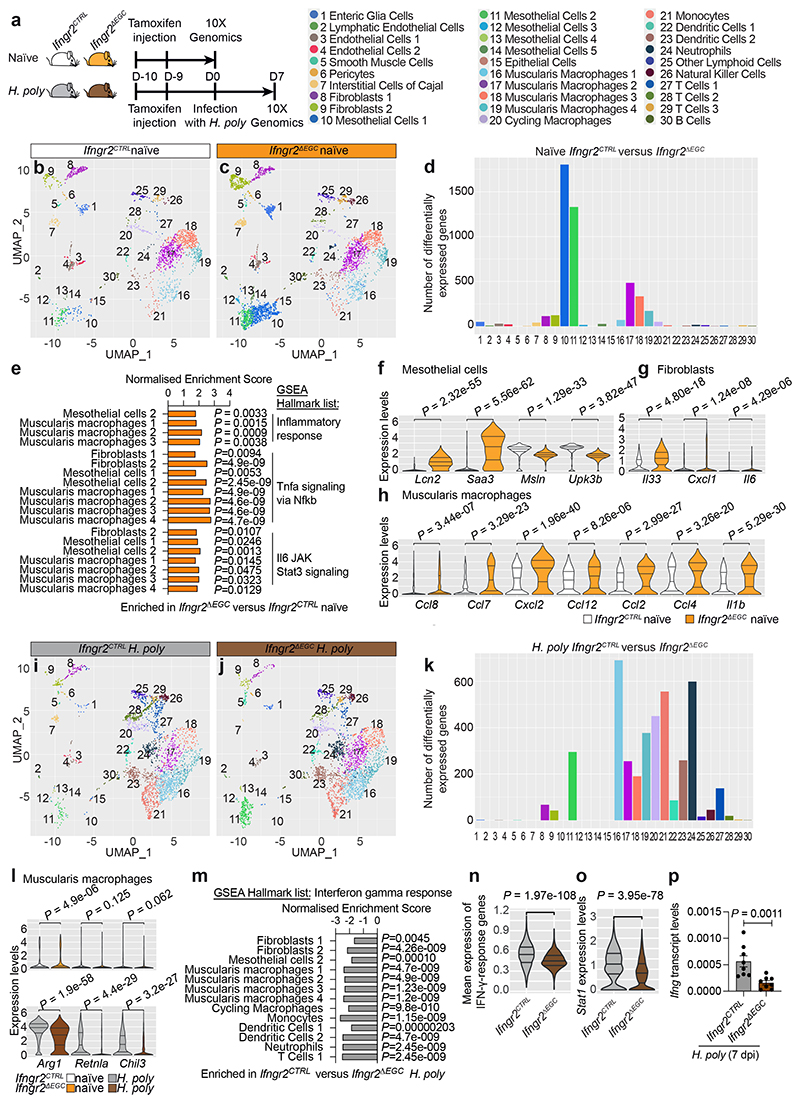
Figure 3. Tissue-wide regulation of immune homeostasis and immune responses in the TM by the IFN-γ-EGC signalling axis.
(a) Genotypes and experimental treatment of mice (color-coded) used for scRNAseq of the TM. (b, c) UMAP of TM cells from naïve Ifngr2CTRL (b) and Ifngr2ΔEGC (c) mice. Identity of cell clusters is indicated (left). (d) Quantification of differentially expressed genes in clusters from naïve Ifngr2CTRL versus Ifngr2ΔEGC mice. (e) GSEA showing selected significant hallmark list terms for inflammatory pathways in the indicated cell clusters from naïve Ifngr2CTRL and Ifngr2ΔEGC mice. (f-h) Violin plot quantification of selected differentially expressed genes in mesothelial cells (f), fibroblasts (g) and muscularis macrophages (h) from naïve Ifngr2CTRL and Ifngr2ΔEGC mice. (i, j) UMAP of TM cells from H. poly-infected Ifngr2CTRL (i) and Ifngr2ΔEGC (j) mice. (k) Quantification of differentially expressed genes in cell clusters from H. poly-infected Ifngr2CTRL versus Ifngr2ΔEGC mice. (l) Violin plot quantification of expression of Arg1, Retnla and Chil3 in muscularis macrophages from naïve and H. poly-infected Ifngr2CTRL and Ifngr2ΔEGC mice. (m) GSEA showing selected significant hallmark list term for IFN-γ response in the indicated cell clusters from H. poly-infected Ifngr2CTRL and Ifngr2ΔEGC mice. (n, o) Violin plot of mean scaled expression of IFN-γ response-associated genes (from the GO term “response to IFN-γ”; n) and Stat1 (o) across all UMAP clusters. (p) qRT-PCR of Ifng in H. poly-infected TM (7 dpi). Mean±SEM. n=8, two experiments. Wilcoxon test (f, g, h, l, n, o), two-tailed Mann-Whitney test (p).

