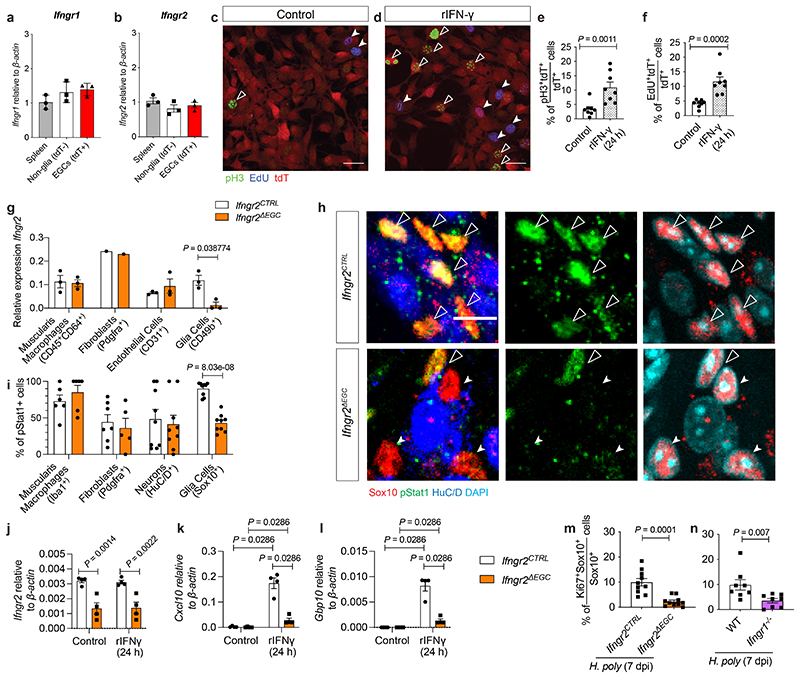
Extended Data Figure 3. Cell autonomous activation of EGCs by IFN-γ.
(a, b) qRT-PCR analysis of Ifngr1 (a) and Ifngr2 (b) transcript levels from spleen cells and FACS-isolated EGCs (tdT+) and non-glia cells (tdT-) from Sox10|tdT mice. n=3. (c, d) Cultures of FACS-isolated EGCs from Sox10|tdT mice in the absence (c) or presence (d) of IFN-γ immunostained for pH3 (green) and labelled with EdU (blue). Scale bars: 100 μm. (e, f) Quantification of pH3+ (e) and EdU+ (f) EGCs (tdT+ cells) in the cultures shown in c and d, respectively. n=8 field of views from each of 3 experiments. (g) qRT-PCR analysis of Ifngr2 transcript levels in muscularis macrophages, fibroblasts, endothelial cells and EGCs FACS-isolated from the TM of Ifngr2CTRL and Ifngr2ΔEGC mice. n=3. (h) Images of IFN-γ-treated (1 hour) myenteric plexus preparations from the duodenum of Ifngr2CTRL and Ifngr2ΔEGC mice immunostained for pStat1, Sox10 and HuC/D and counterstained for DAPI. Indicated are pStat1+ EGCs (empty arrowheads), pStat1- EGCs (filled arrowheads). Scale bar = 10 μm. (i) Quantification of pStat1+ muscularis macrophages, fibroblasts, neurons and EGCs in IFN-γ-treated (1 hour) TM preparations from Ifngr2CTRL and Ifngr2ΔEGC mice. n=8. (j-l) qRT-PCR analysis of Ifngr2, Cxcl10 and Gbp10 transcript levels from rIFN-γ treated EGCs isolated from Ifngr2CTRL and Ifngr2ΔEGC mice. n=4. (m) Quantification of Ki67+ EGCs in the TM of H. poly-infected Ifngr2CTRL and Ifngr2ΔEGC mice at 7 dpi (n=10). (n) Quantification of Ki67+ EGCs in the TM of WT and Ifngr1-/- mice (n=8). 2 experiments (m, n). Two-tailed Mann-Whitney test (e, f, n, o), unpaired two-tailed t-test (g, i, j, k, l, m). Mean±SEM

