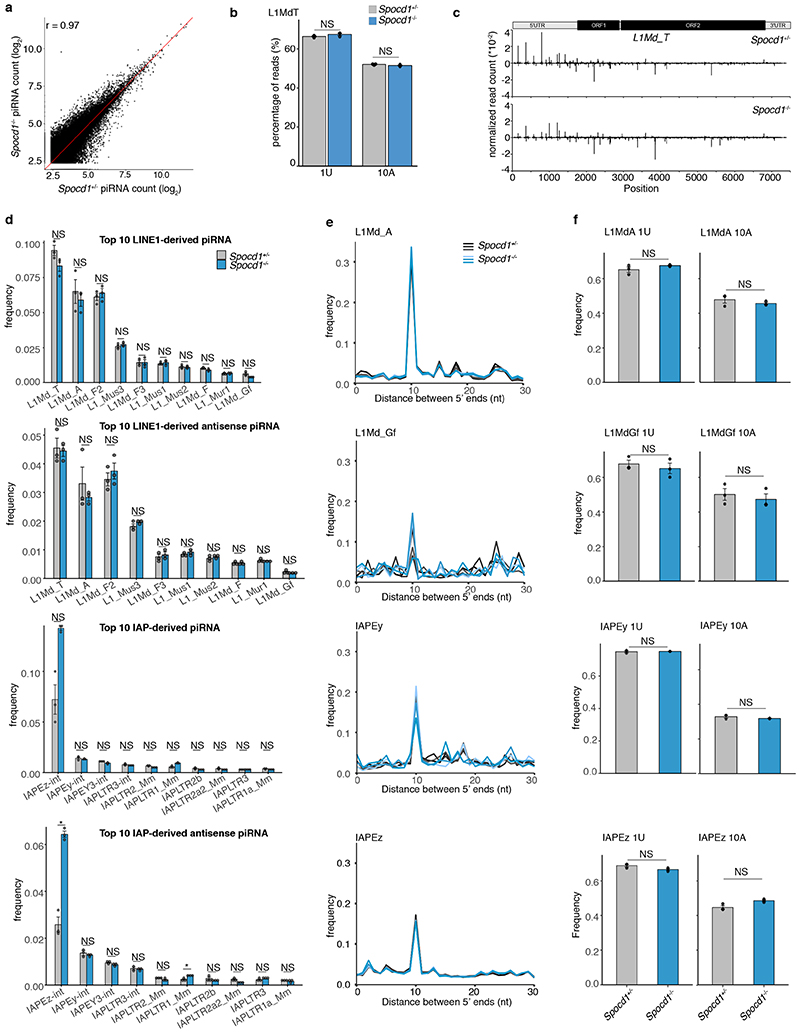
Extended Data Figure 7. piRNA analysis.
piRNA analyses of small RNAs sequenced from E16.5 testis from (n=3) Spocd1+/- and Spocd1-/- mice are presented. a, Relative frequency of piRNAs mapping to LINE1 and IAP families from Spocd1+/- and Spocd1-/- E16.5 testes. Plots are shown for all piRNA or anti-sense piRNAs. Data are mean and s.e.m. Adjusted P-values are listed, P=1.0 values are denoted as NS (Bonferroni adjusted two-sided Student’s t-test). b, Scatter plots showing mean expression of all (n=124411) piRNAs. The identity line is shown in red. r, Pearson’s correlation coefficient. c, Nucleotide features of piRNA from Spocd1+/- and Spocd1-/- E16.5 testes. Frequency of mapped piRNAs with a U at position 1 (1U) and with an A at position 10 (10A) are shown for L1Md_T elements. Data represent the mean and s.e.m. Adjusted P-values are shown (Bonferroni adjusted two-sided Student’s t-test) d, Ping-pong analysis of piRNAs from Spocd1+/- and Spocd1-/- E16.5 testis. Relative frequencies of the distances between 5’ ends of complementary piRNAs are shown for the indicated LINE1 and IAP families. e, Nucleotide features of piRNA from Spocd1+/- and Spocd1-/- E16.5 testis. Relative frequencies of piRNAs with a U at position 1 (1U) and with an A at position 10 (10A) are shown for respective elements shown in (d). Data are mean and s.e.m. Adjusted P-values are listed, P=1.0 values denoted as NS (Bonferroni adjusted two-sided Student’s t-test) f, Positions of piRNAs mapped to the consensus sequence of L1Md_T. Positive and negative values indicate sense and antisense piRNAs, respectively. Schematic representation of L1Md_T is shown above.

