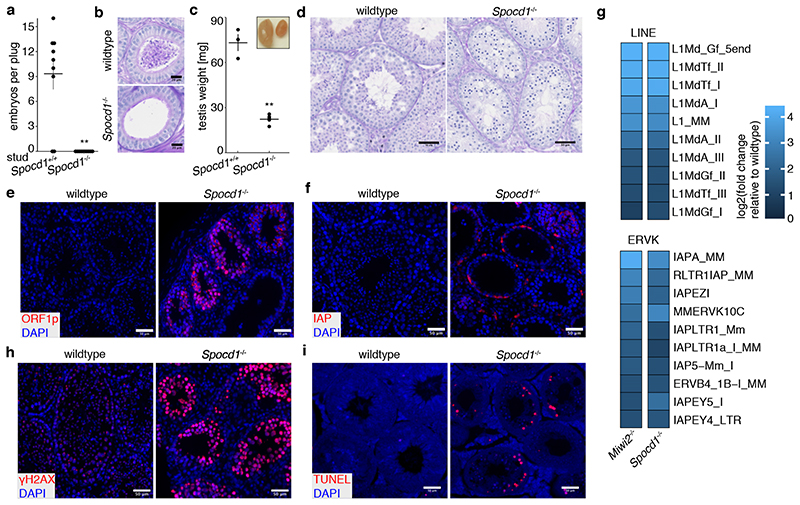
Figure 2. SPOCD1 is required for spermatogenesis and LINE1/IAP silencing.
a, Number of E16.5 embryos per plug of studs with the indicated Spocd1 genotype mated to wildtype females are presented. Data are mean and s.e.m. from n=3 Spocd1+/+ studs (9 plugs total) and n=4 Spocd1-/- studs (10 plugs total). **P~0.001, two-sided Student’s t-test. b, Representative images of PAS & Haematoxylin stained epididymis sections from (n=3) adult mice with the indicated genotype are shown. Scale bars, 20 μm. c, Average testicular weight in mg from adult mice with the indicated Spocd1 genotype is plotted. Insert shows a representative image of wildtype (left) and Spocd1-/- testes. Data are mean and s.e.m. from n=3 wildtype and n=5 Spocd1-/- mice. **P~0.01, two-sided Student’s t-test. d, Representative PAS & Haematoxylin stained testis sections of (n=3) adult mice of the indicated Spocd1 genotype is shown. Scale bars, 50 μm. e, f, Representative images of testis sections from (n=3) adult wildtype and Spocd1-/- mice stained for LINE1 ORF1p (e) or IAP-GAG protein (f) (red) are shown. DNA was stained with DAPI (blue). Scale bars, 50 μm. g, RNA-seq derived heat maps depicting fold-change of expression relative to wildtype for the 10 most up-regulated LINE and ERVK TEs in (n=3) Miwi2-/- and Spocd1-/- P20 testis. h, i, Representative images of testis sections of (n=3) adult wildtype and Spocd1-/- mice stained for the DNA damage response marker γH2AX (h) and TUNEL staining revealing apoptotic cells (i) (red). DNA was stained with DAPI (blue). Scale bars, 50 μm.

