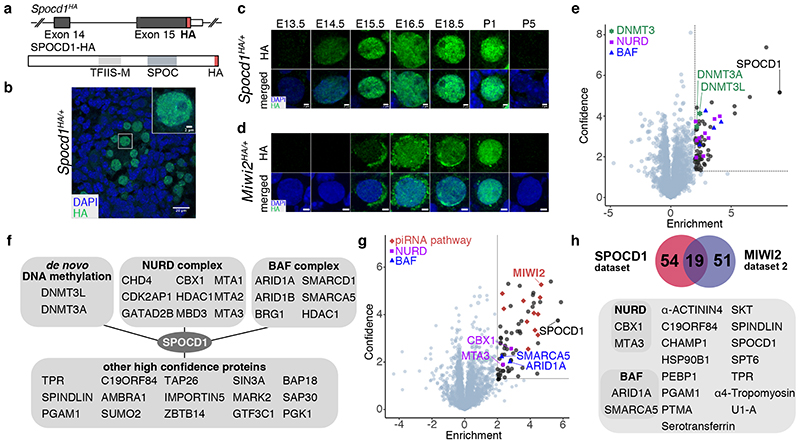
Figure 4. SPOCD1 is a nuclear protein that associates with the de novo DNA methylation machinery and repressive chromatin remodelling complexes.
a, Schematic representation of the Spocd1HA allele and the C-terminal HA-tagged SPOCD1 protein. b, Representative image of SPOCD1-HA localization in gonocytes at E16.5 from (n=3) Spocd1HA/+ mice. Scale bar, 20 μm. Insert shows a zoom in of the indicated foetal gonocyte. Scale bar, 2 μm. c, d, Representative images of expression of SPOCD1-HA (c) and HA-MIWI2 (d) in gonocytes at the indicated time points from (n=3) Spocd1HA/+ and Miwi2 HA/+ mice, respectively, are shown. Scale bars, 2 μm. e, Volcano plot showing enrichment (log2(mean LFQ ratio of SPOCD1-HA IP/control IP from Spocd1+/+ foetal testis) and statistical confidence (-log10(P-value of two-sided Student’s t-test)) of proteins co-purifying with SPOCD1-HA from E16.5 testis lysates (n=4). Dotted line indicates enrichment >4-fold and significance P<0.05. DNMT3L and DNMT3A (green), members of the NURD (violet) and BAF (blue) complexes are highlighted. f, Schematic representation of selected proteins co-purifying with SPOCD1. g, Volcano plot as presented in panel e of proteins co-purifying with MIWI2-HA from E16.5 testis Benzonase-solubilized extracts (n=4). h, Schematic representation of overlap of proteins co-purifying with both SPOCD1 and MIWI2.

