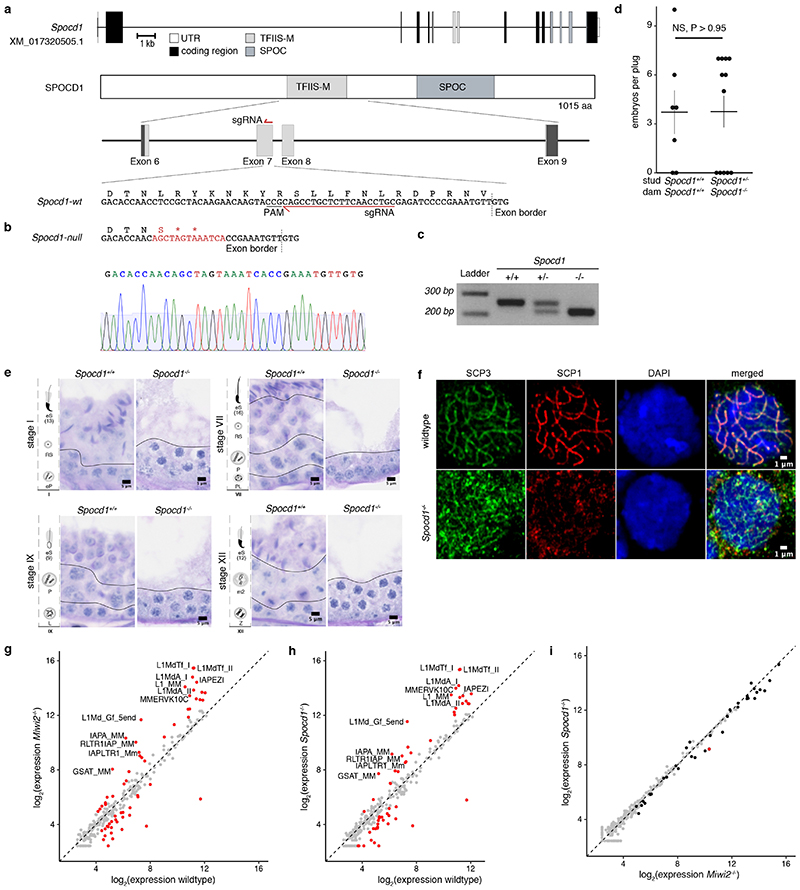
Extended Data Figure 4. Generation and characterisation of the Spocd1null mouse allele.
a, Schematic representation of the Spocd1 locus and the encoded 1015 amino acids (aa) protein (transcript XM_017320505.1) as well as design of the sgRNA targeting Spocd1 exon 7, which harbours part of the TFIIS-M domain. b, Schematic representation and sequencing trace (lower) of the part of Spocd1null exon 7 harbouring the mutation site. The mutated site, highlighted in red, contains 2 premature stop codons and causes a frame-shift. Sequencing was repeated with identical results on n=3 animals. c, Representative image of genotyping results for Spocd1+/+ , Spocd1+/- and Spocd1-/- animals. Similar results were obtained for all animals of the Spocd1- line. d, Number of E16.5 embryos per plug from matings of mice with the indicated Spocd1 genotypes are presented. Mean and s.e.m. from n=7 Spocd1+/+ dams mated to n=3 Spocd1+/+ studs and n=12 Spocd1-/- dams mated to n=5 Spocd1+/- studs is plotted. NS, non-significant difference (P~0.98), two-tailed Student’s t-test. e, Representative PAS and haematoxylin stained histological testis sections of different stages of the seminiferous cycle are shown of (n=3) Spocd1+/+ and Spocd1-/- animals, indicating a germ cell differentiation arrest at the early pachytene stage. Scale bar, 5 μm. eP, early pachytene; RS, round spermatids, eS(13) elongating spermatids (step 13); PL, pre-leptotene; P, pachytene; L, leptotene; Z, zygotene; m2, secondary meiocytes. f, Representative images of zygotene spermatocytes in wildtype and Spocd1-/- adult testis sections stained for the synaptonemal complex proteins SCP1 (red) and SCP3 (green). DNA stained with DAPI (blue). Scale bar, 1 μm. The representative images presented in panels e and f are from n=3 mice per genotype. g, h Analysis of TE expression in P20 testes from n=3 wildtype, Spocd1-/- and Miwi2-/- mice by RNA-seq. g, Comparison of TE expression in Miwi2-/- and wildtype testes is shown. TEs with a significantly different (P<0.01, Benjamini-Hochberg adjusted two-sided Wald’s test) change in expression (>2-fold) are highlighted in red and the top 12 most up-regulated TEs in Miwi2-/- testes are labelled. h, Comparison of TE expression in Spocd1-/- and wildtype testes is shown. TEs with a significantly different (P<0.01, Benjamini-Hochberg adjusted two-sided Wald’s test) change in expression (>2-fold) are highlighted in red and same TEs as in (a) are labelled. i, Comparison of TE expression in Spocd1-/- and Miwi2-/- testes is shown. TEs with a significantly different (P<0.01, Benjamini-Hochberg adjusted two-sided Wald’s test) change in expression (>2-fold) are highlighted in red. TEs which are significantly up-regulated in Miwi2-/- relative to wildtype are highlighted in black.

