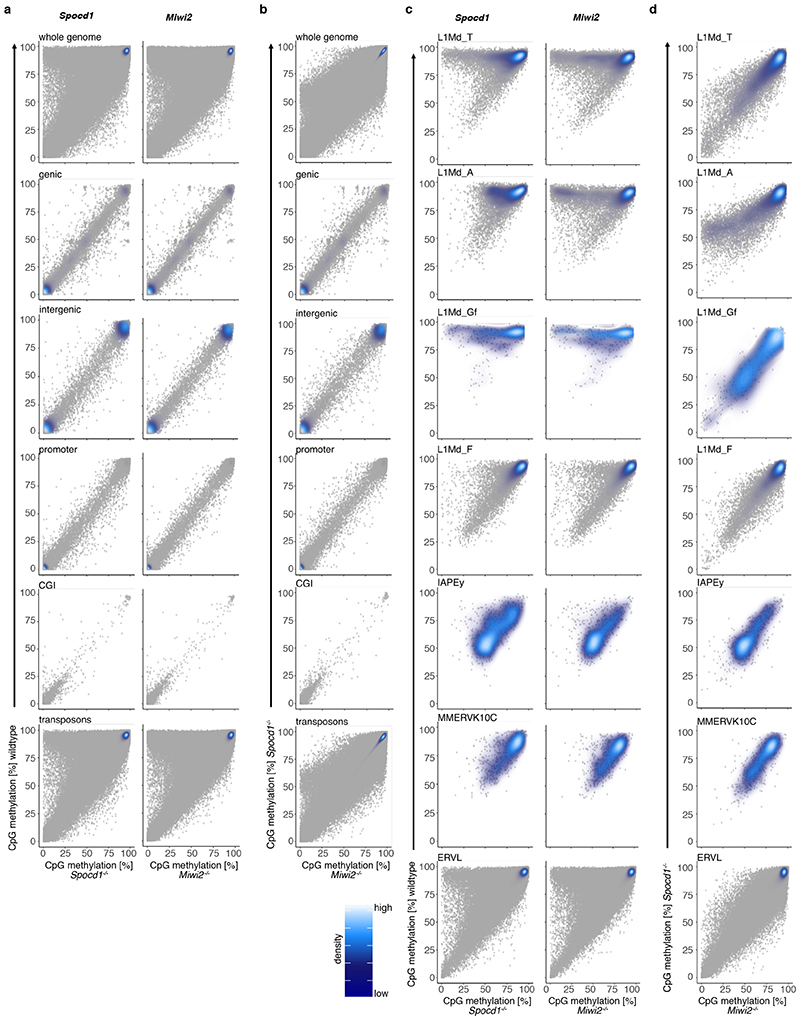
Extended Data Figure 5. CpG Methylation analysis of different genomic features and TE families.
Analysis of genomic CpG methylation of undifferentiated P14 spermatogonia from (n=3) wildtype, Spocd1 -/- and Miwi2 -/- mice is presented. a, b, Scatter plots comparing CpG methylation levels for the respective genomic features between wildtype and Spocd1-/- or Miwi2-/- (a) and between Spocd1-/- or Miwi2-/- spermatogonia (b) are shown. c, d, Scatter plots comparing CpG methylation levels for the respective TE families between wildtype and Spocd1-/- or Miwi2-/- (c) and between Spocd1-/- or Miwi2-/- spermatogonia (d) are shown. Data is mean from n=3 biological replicates per genotype and shown as individual data points (grey) overlayed by a density map.

