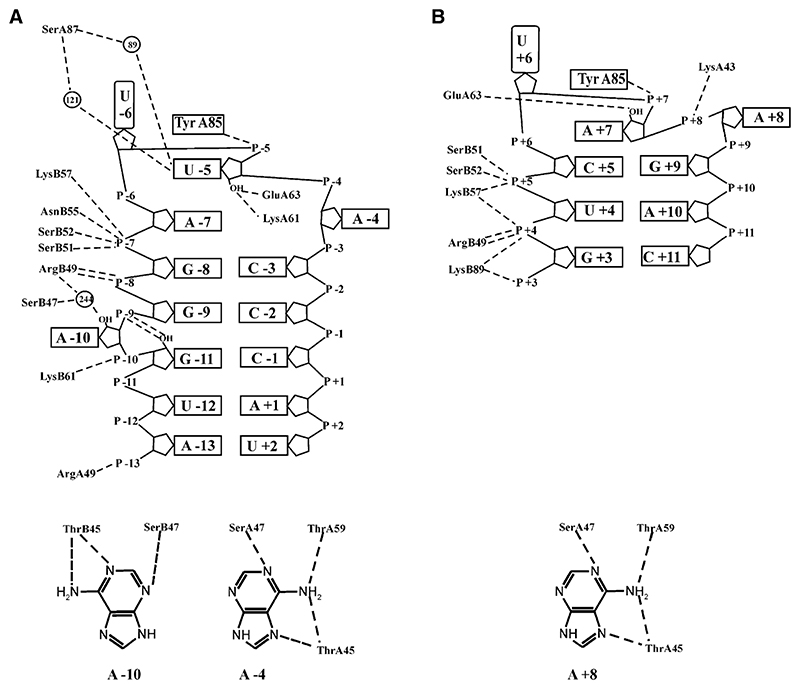
Figure 3. Schematic Showing RNA-Protein Hydrogen Bond Interactions in the 87SerMS2 and 87Ser89LysQβ Complexes.
(A and B) (A) 87SerMS2. (B) 87Ser89LysQβ. Putative hydrogen bond contacts are shown as black, dashed lines where atoms lie within 3.3 Å of each other. Ordered water molecules are shown as black circles. The details of the interactions at the adenine binding pockets are shown below the main diagram.

