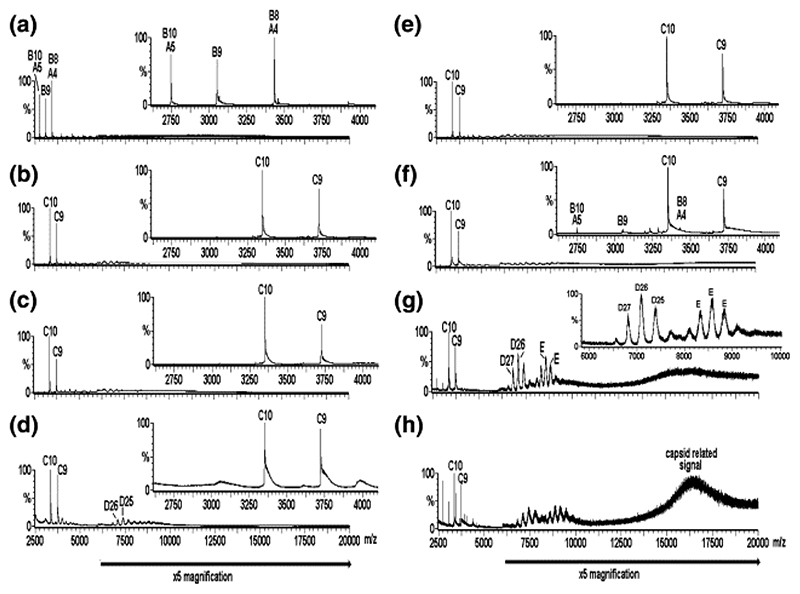
Figure 2.
Virus capsid reassembly monitored over time by real-time nanoESI-MS. The spectra were acquired over the range m/z 500−30,000 for samples in ammonium acetate (40 mM) at pH 5.2−5.7. The components are labeled as follows: A = CP; B = CP2; C = CP2:TR; D = 182.7 kDa, assigned as [3(CP2:TR)+3CP2], and E = ∼ 288−300 kDa, unassigned. The number immediately following each letter is the charge state of those particular ions, i.e., [M+ nH]n+. The spectra are as follows: (a) CP alone (8 μM); pH 3.2; (b)−(d) are for reassembly at pH 5.2−5.7 at a stoichiometry of CP2 to TR 1:1 (8 μM:8 μM), at 1, 90, 300 min, respectively. Spectrum (e) is the 1:1 pre-equilibrated starting point for reassembly at a stoichiometry of CP2 to TR 2:1 (16 μM:8 μM), spectra (f)−(h), at 1, 120, and 180 min, respectively. Note that spectra (b) and (e) are essentially equivalent. The bars below the spectra indicate a magnification factor of 5 for all ions above m/z 6000 to enhance clarity. The insets in (a)− (f) highlight the range m/z 2600−4100 to enhance clarity in the region containing ions arising from components A, B, and C. The inset in (g) highlights the range m/z 6000−10,000 to enhance clarity of the ions arising from components D and E and is normalized to the D26 ions, which are ∼10% of the intensity of the full spectrum.

