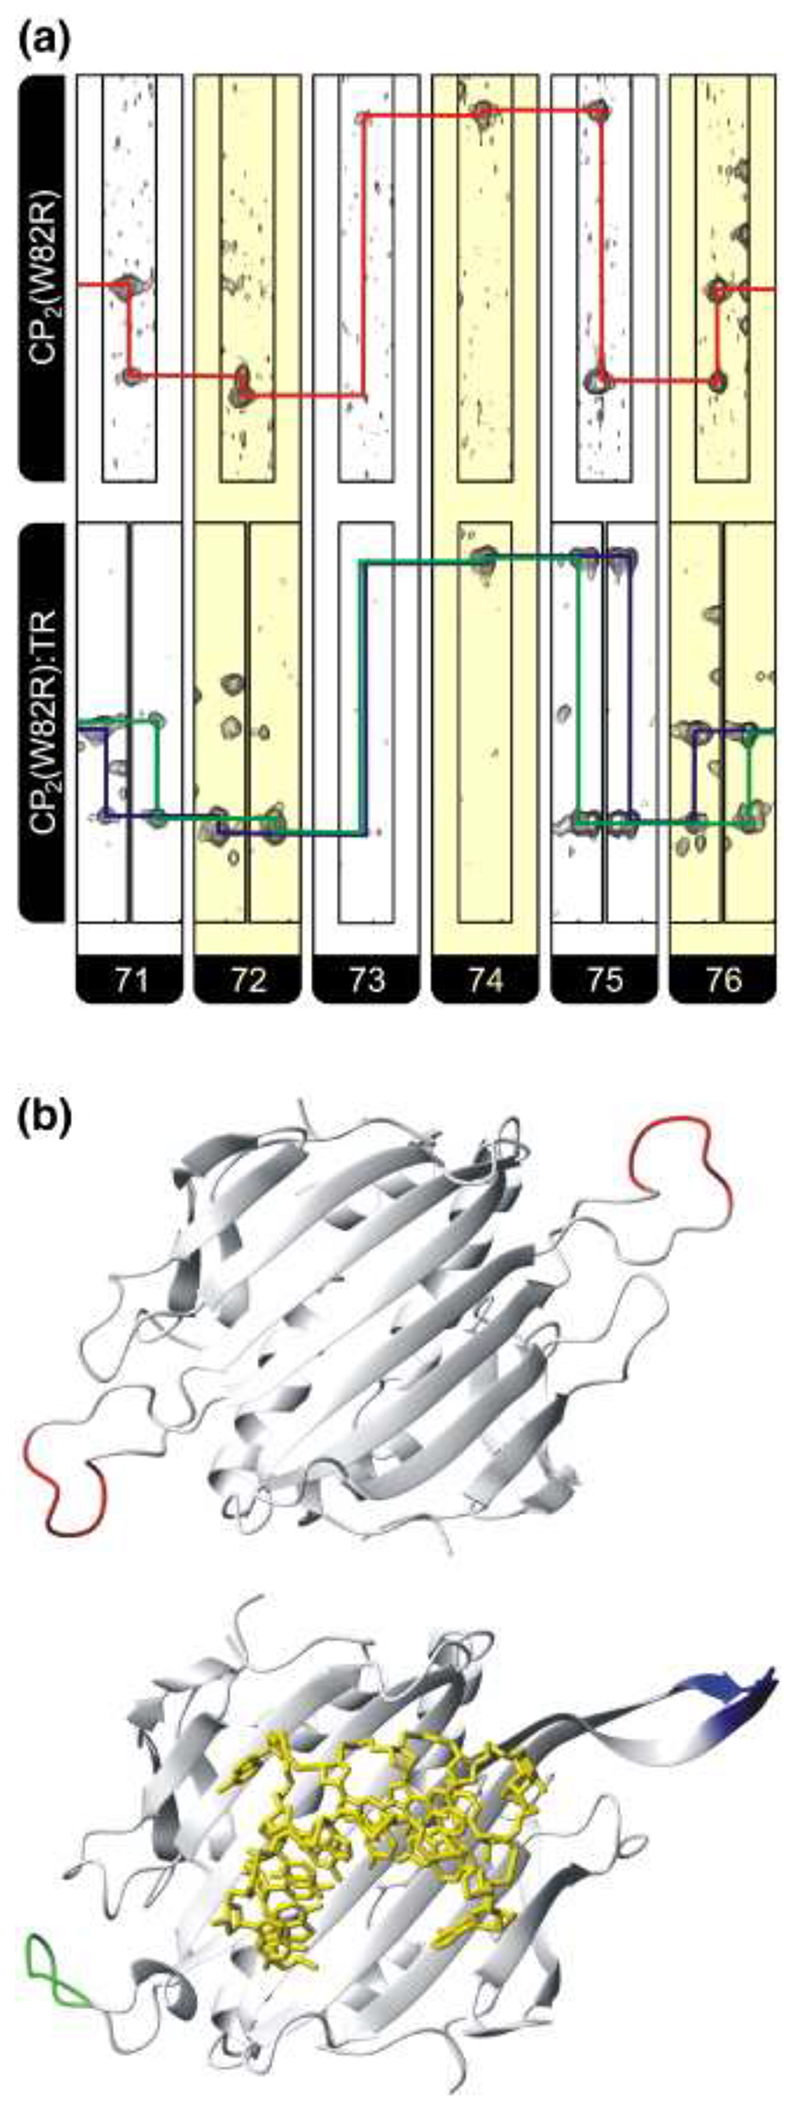
Figure 4. Observed changes in the chemical shifts for the FG loop residues 71−76 in both apo and RNA-bound complexes.
(a) Strips, alternately colored white and yellow for each residue, from HNCA spectra of CP2(W82R) (top) and CP2(W82R):TR (bottom). The assignment pathway for CP2(W82R) is shown in red while the split pathways for the complex are in blue and green. Note that no assignment of resonances to specific FG loop conformations is made or assumed. (b) Cartoon representation of (top) the backbone of CP2(W82R) showing the position of residues 71−76 in red for the two CP subunits derived from the crystal structure of this mutant 38 (Protein Data Bank 1MSC) and (bottom) the equivalent view for a wild-type A/B dimer (green/blue) bound to TR RNA (yellow sticks), which is the conformation we assume is closest to that present in solution.

