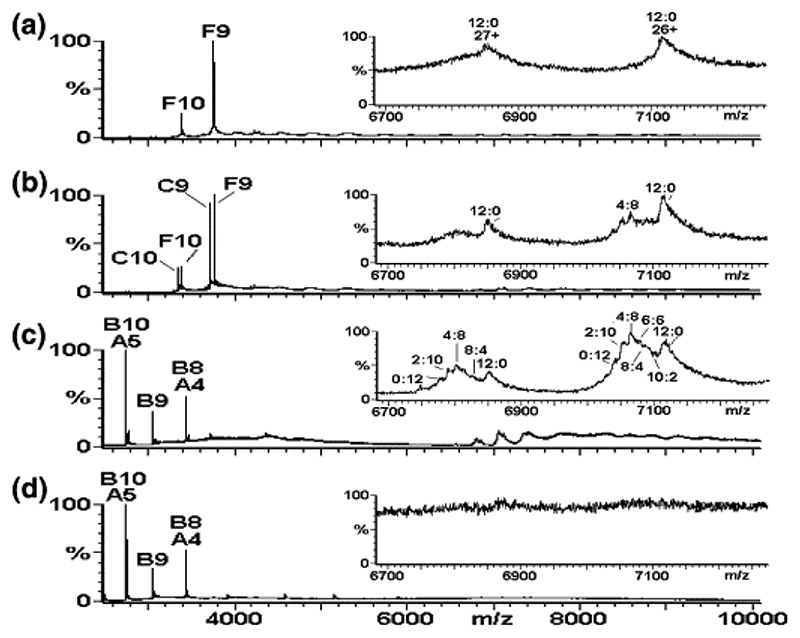
Figure 5.
Mapping the capsid reassembly pathway using isotopic chase experiments. Virus capsid reassembly from 15N-labeled CP2 chased by adding increasing quantities of 14N-CP2, with each reaction monitored by real-time nanoESI-MS at t = 1 min. The spectra were acquired over the range m/z 500−10,000 for samples in 40 mM ammonium acetate, pH 5.2−5.7. The larger panels show the range m/z 2500−10,000 and the components are labeled as follows: A = CP; B = CP2; C = CP2:TR; F = 15N-CP2:TR. The number immediately following each letter is the charge state of those particular ions. Spectra are (a) 15N-CP2 to TR 1:1 (8 μM:8 μM), t = 1 min; (b) 15N-CP2 to TR 1:1 (8 μM:8 μM) with 14N-CP2 (8 μM) added, t = 1 min; (c) 15N-CP2 to TR 1:1 (8 μM:8 μM) with 14N-CP2 (24 μM) added, t = 1 min; (d) 15N-CP2 to TR 1:1 (8 μM:8 μM) with 14N-CP2 (32 μM) added, t = 1 min. Inset spectra highlight the range m/z 6700−7200, showing the 26+ and 27+ charge states of the major reassembly intermediate [3(CP2:TR)+3CP2]. The peaks are labeled with the ratio of 15N:14N CP contained in the species, i.e., 12:0, 10:2, 8:4, 6:6, 4:8, 2:10, and 0:12.

