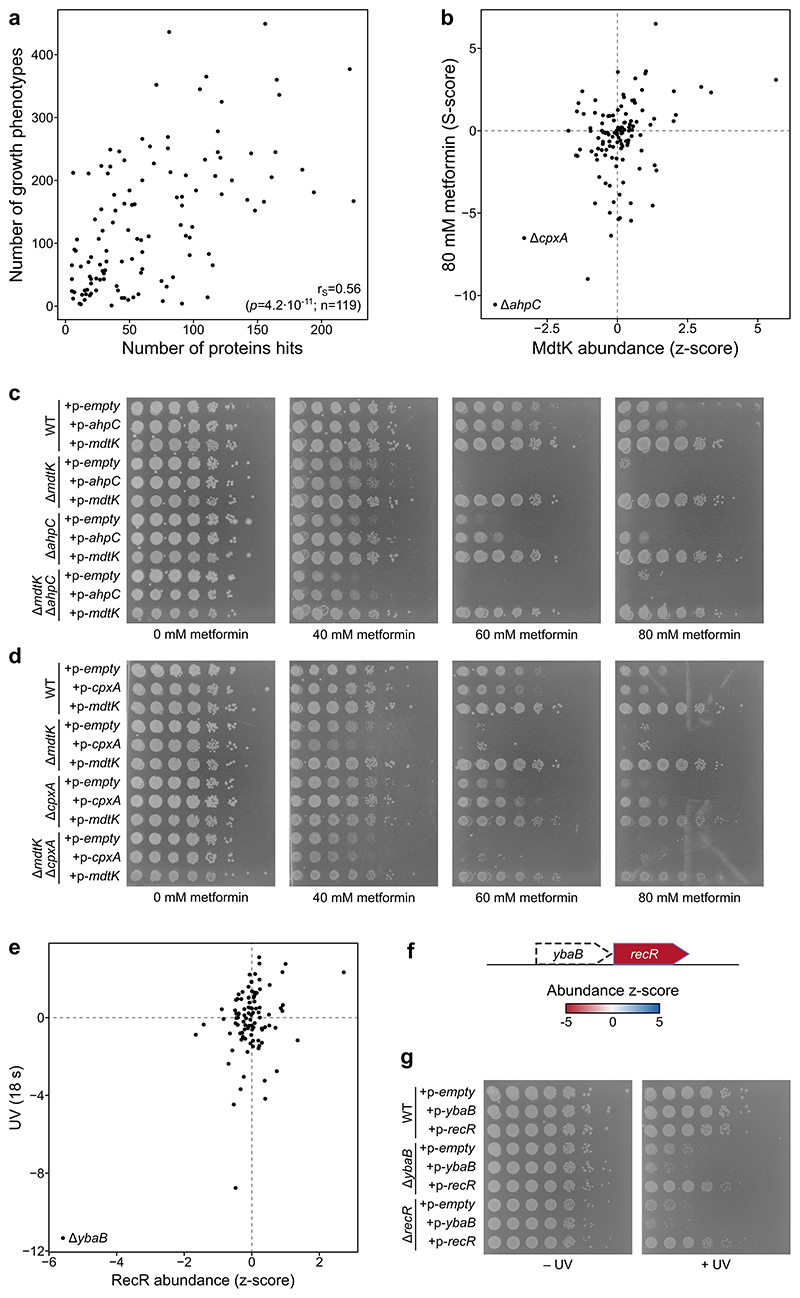
Extended Data Figure 10. Protein abundance and thermal stability changes explain growth phenotypes of E. coli mutants.
(a) Scatter plot of number of significantly affected proteins (abundance or thermal stability) in each mutant (x-axis) and the number of significant growth phenotypes of the same mutant (y-axis; data from Herrera-Dominguez 12 ). p refers to the correlation p-value and n to the number of mutants. (b) Scatter plot of MdtK abundance in mutants profiled in this study and their sensitivity to 80 mM metformin 12 (r=0.44; n=119 mutants). (c-d) Spot assay for the indicated strains overexpressing mdtK, ahpC or cpxA, or a control empty plasmid in plates containing 0-80 mM metformin. Cells were diluted to OD578=0.5, serially diluted in 10-fold steps, and spotted on LB agar plates containing 10 μg/ml tetracycline (to maintain plasmid), 0.1 mM IPTG (to induce expression of encoded gene), and metformin as indicated. (e) As in panel b, but showing correlation of RecR abundance and UV exposure for 18 s (r=0.53; n=99 mutants). (f) Schematic representation of the ybaB-recR operon and protein abundance scores in the ΔybaB mutant. (g) Spot assay for the indicated strains overexpressing ybaB, recR, or a control empty plasmid after exposure to UV with a total energy of 85 mJ/cm2 or control non-exposed plate. Cells were diluted to OD578=0.1 and then serially diluted in 10-fold steps, and spotted on LB agar plates containing 50 μg/ml ampicillin (to maintain plasmid) and 0.1 mM IPTG (to induce expression of encoded gene).

