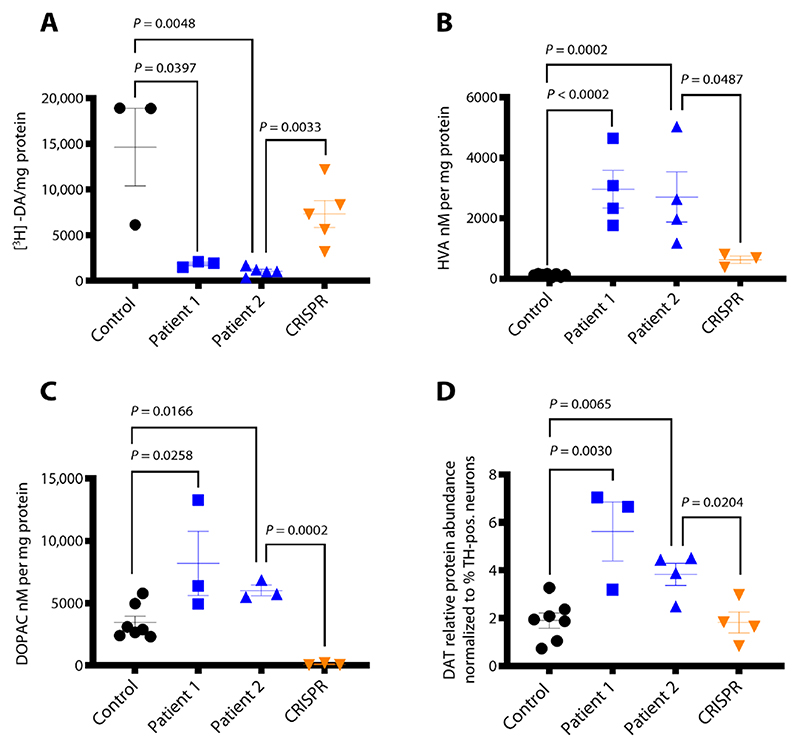
Fig. 1. DTDS-patient derived mDA neurons recapitulate key disease features.
(A) [3H]dopamine uptake measured at day 65. Values are relative to protein concentration (n = 3, 3, 5, and 5 for control, patient 1, patient 2, and CRISPR, respectively). (B and C) HPLC detection of extracellular HVA and DOPAC at day 65 (n = 8, 4, 4, and 3, respectively, and n = 7, 3, 3, and 3, respectively). (D) Quantification of DAT protein detected in day 65 neurons derived from control, patient 1, patient 2, and CRISPR lines, relative to glyceraldehyde-3-phosphate dehydrogenase (GAPDH) and normalized to percentage of TH-positive cells in each neuronal population as reported in Fig. 3B (n = 7, 3, 4, and 4, respectively). Error bars indicate SEM. Both DTDS lines were independently compared to controls using two-tailed Student’s t test for all analyses.

