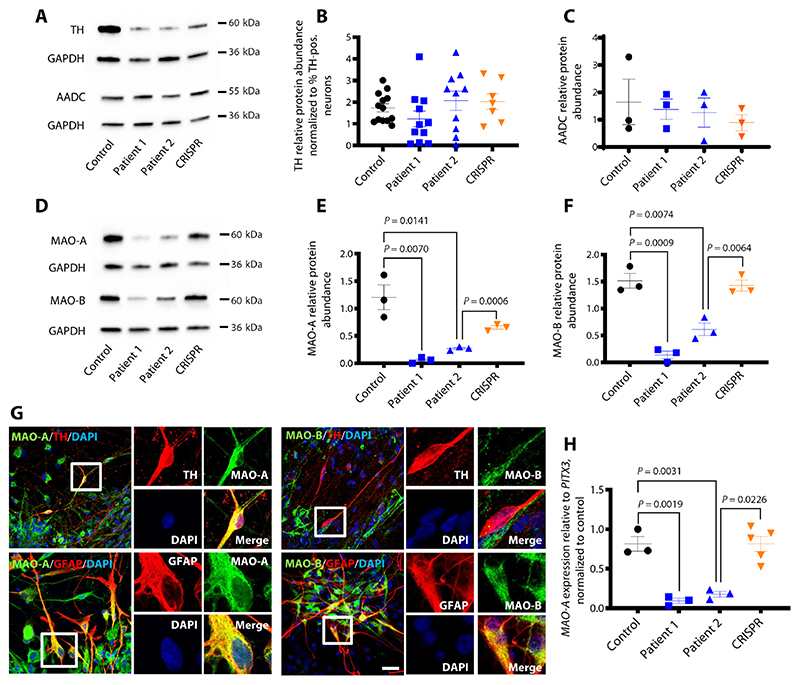
Fig. 2. DTDS-patient derived mDA neurons show dysregulation of key enzymes involved in DA catabolism.
(A) Cropped immunoblot of total TH protein and AADC detected at day 65. (B) Relative abundance of TH protein detected at day 65 in control, patient 1, patient 2, and CRISPR, relative to housekeeping gene GAPDH and normalized to percentage of TH-positive cells in each sample as reported in Fig. 3B (n = 13, 11, 10, and 7, respectively). (C) Quantification of AADC protein relative to GAPDH (n = 3 per line). (D) Cropped immunoblot of total MAO-A, MAO-B, and GAPDH at day 65. (E) Quantification of MAO-A protein relative to GAPDH (n = 3 per line). (F) Quantification of relative MAO-B abundance in control and patient-derived neurons (n = 3 per line). (G) Immunofluorescence analysis of MAO-A/TH and MAO-A/GFAP (left) and MAO-B/TH and MAO-B/GFAP (right) in Control mDA neural culture at day 65 of differentiation. Nuclei were counterstained with DAPI (blue). Scale bar, 20 μm. (H) qRT-PCR for MAO-A at day 65 in Control: Patient 1, Patient 2, and CRISPR. mRNA values are relative to the mDA related gene PITX3 and normalized to control (n = 3, 3, 3, and 5 respectively). Error bars indicate SEM. Both DTDS lines were independently compared to controls using two-tailed Student’s t test for all analyses.

