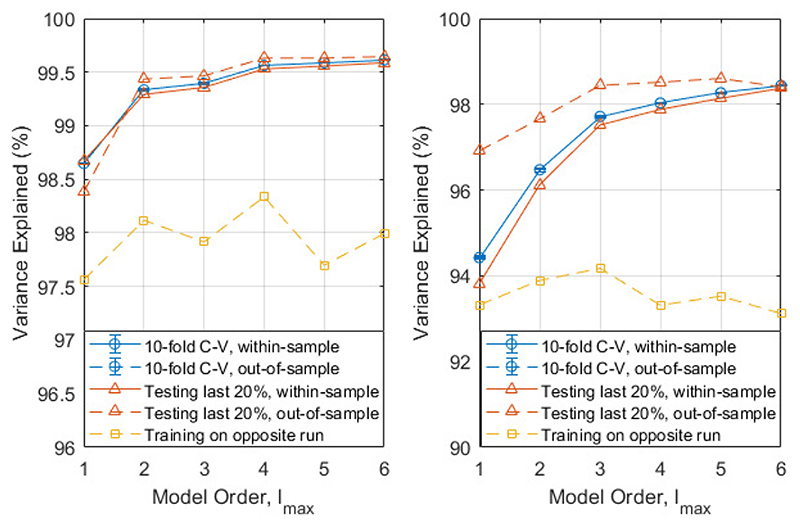
Fig. 5.
Variance explained ( R 2) by different order spherical harmonic models in three different analyses: 10-fold cross-validation (blue circles), training on the first 80% of the data (orange triangles) and training on the opposite run (yellow squares). The within-sample (testing and training data are the same) variance explained is given by complete lines, the out-of-sample (testing and training data are different) variance explained is given a dashed line. The two recordings are shown on separate graphs. Run 1 (left) was recorded first, then run 2 (right) recorded 20 minutes later. Note the different scales on the two graphs.

