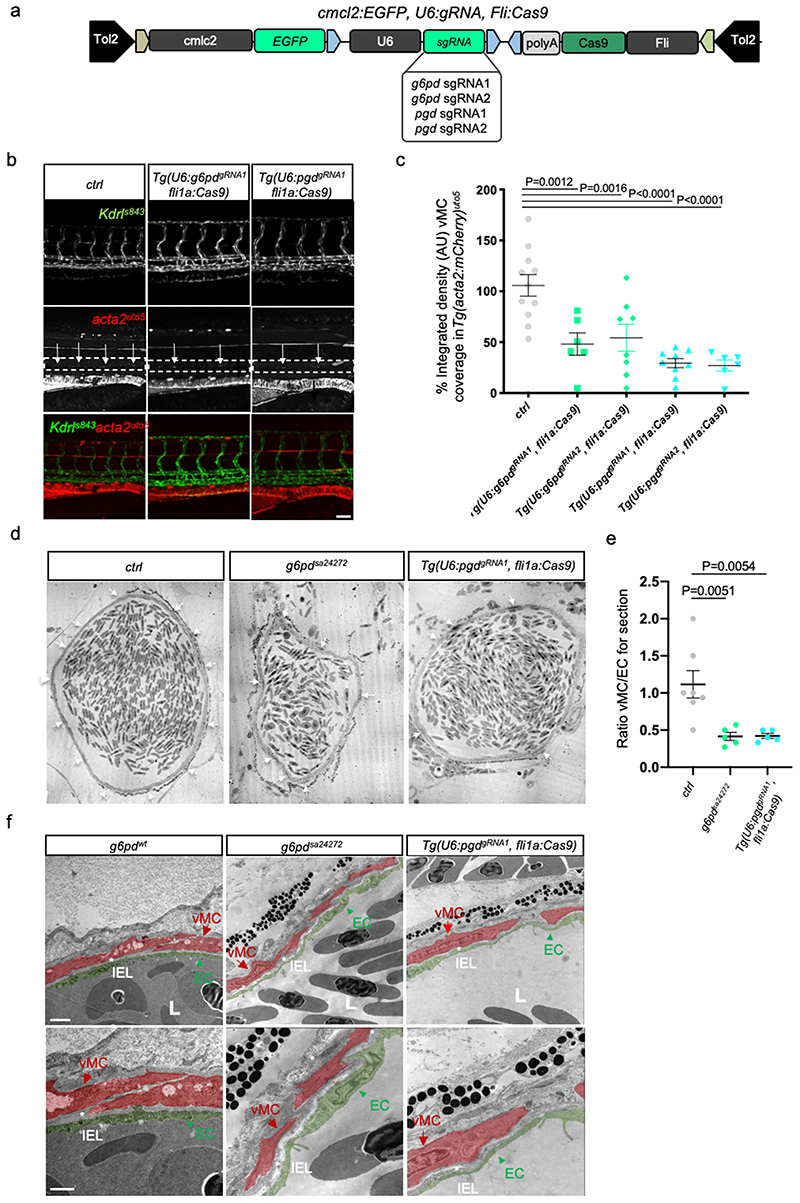
Figure 2. Endothelial oxPPP control vMC coverage of dorsal aorta (DA) in zebrafish.
a, Schematic representation of the plasmids used for injection for EC-specific CRISPR-based KO technology.
b, Images of partial z-projection of the trunk region (somite 8-14) of a Tg(kdrl:eGFP)s843 ;Tg(acta2:mCherry)uto5 zebrafish embryo after the injection with Tol2 mRNA and the following plasmids: U6:g6pdgRNA1; fli1a:Cas9 and U6:pgdgRNA1; fli1a:Cas9, respectively. Arrows in the dashed box area indicate vMC coverage. Scale bar, 100 μm.
c, Scatter plots show the quantification of vMC coverage in the DA (dashed box area) of embryos, using also the second gRNA for both g6pd and pgd (Extended Data Fig. 3a). Tg(U6:g6pddgRNA1; fli1a:Cas9) (n=11), Tg(U6:g6pddgRNA2; fli1a:Cas9) (n=6), Tg(U6:pgdgRNA1; fli1a:Cas9) (n=8), Tg(U6:pgdgRNA2; fli1a:Cas9) (n=6) embryos from 2 independent experiments. Data are shown as mean ± SEM. Statistical analysis was done by one-way ANOVA followed by Tukey’s multiple comparison test.
d, Representative transmission electron microscopy (TEM) images of transverse sections in g6pd full KO (g6pdsa24272 ) and EC-specific pgd KO Tg(U6:pgdgRNA1; fli1a:Cas9) zebrafish animals. Arrows indicate vMC coverage in DA. Scale bar, 10μm.
e, Scatter plots show the quantification of vMC/EC ratio in the DA in TEM images of transverse sections in ctrl, g6pd full KO (g6pdsa24272 ) and EC-specific pgd Tg(U6:pgdgRNA1; fli1a:Cas9). Control (n=7), g6pdsa2427 (n=5), Tg(U6:pgdgRNA1; fli1a:Cas9) (n=5) fish from 3 independent experiments. Data are shown as mean ± SEM. One-way ANOVA followed by Dunn’s multiple comparison test was applied for statistical analysis.
f, High-magnification TEM images of transverse section in g6pd full KO (g6pd sa24272) and EC-specific KO of pgd Tg(U6:pgdgRNA1, fli1a:Cas9) zebrafish animal show a vascular lumen (L) and the lining EC surrounded by tightly apposed vMC. Images show EC (arrowhead), vMC (arrow) and IEL organization in wt e mutant animals. EC and vMC are pseudo-colored in green and red, respectively. vMC=mural cells, EC=endothelial cells. IEL=internal elastic laminae. L= lumen. Images are representative of at least five independent experiments (n=5) with similar results. Scale bars, 1μm and 2 μm.

