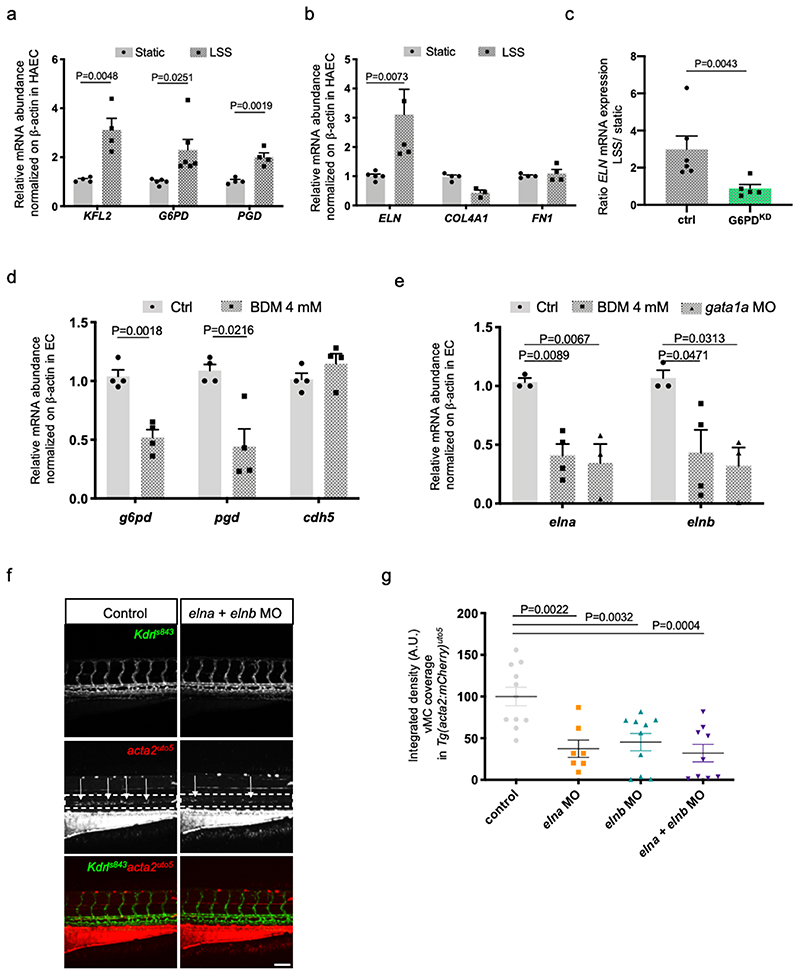
Figure 5. Hemodynamic forces promote vMC coverage through oxPPP and ELN expression.
a, Effects of shear stress on the expression of G6PD and PGD genes exposed to 24hr of LSS (Laminar Shear Stress) in human endothelial cell lines (HAEC). KLF2 was used a positive control being a flow-induced gene. N=4 from three independent experiments. Data are shown as mean ± SEM. Statistics were done using unpaired Student’s t-test.
b, Effects of shear stress on the expression of different ECM target genes in HAEC after 24hr of LSS. n=4 from three independent experiments. Data are shown as mean ± SEM. Statistics were done using unpaired Student’s t-test.
c, qRT-PCR analysis of ELASTIN expression after LSS in G6PDkd EC. Scatter plots show the quantification of LSS/Static ratio in control and G6PDKD in HAEC. n=5 from four independent experiments. Data are shown as mean ± SEM. Statistics were done using unpaired Student’s t-test.
d, qRT-PCR analysis of pgd and g6pd expression in ECs sorted from Tg(kdrl:eGFP)s843 treated with BDM 4mM or control at 72 hpf. n=4 from two independent experiments. Fifty GFP-positive embryos from Tg(kdrl:eGFP)s843 were used in each sample. Data are shown as mean ± SEM. Statistics were done using unpaired Student’s t-test.
e, qRT-PCR analysis of elna and elnb expression in ECs sorted from Tg(kdrl:eGFP) embryos treated with BDM or injected with control or gata1 MO at 72hpf. Ctrl and gata1a MO (n=3), BDM (n=4) from two independent experiments. Fifity GFP-positive embryos from Tg(kdrl:eGFP)s843 were used in each sample. Data are shown as mean ± SEM. Statistics were done using one-way ANOVA followed by Dunnet’s multiple comparison test.
f, Confocal images of partial z-projection of the trunk region (somite 8-14) of a Tg(kdrl:eGFP)s843 ;Tg(acta2:mCherry)uto5 embryo at 4dpf after elna and elnb antisense morpholino (MO) injection. Scale bar, 100 μm.
g, Scatter plots show the defect in vMC coverage in elna/elnb morphants at 4dpf. Ctrl (n=11), elna MO (n=7), elnb MO (n=10), elna/elnb MO (n=9) embryos from 2 independent experiments. Data are shown as mean ± SEM. Statistics were done using one-way ANOVA followed by Tukey’s multiple comparison test.

