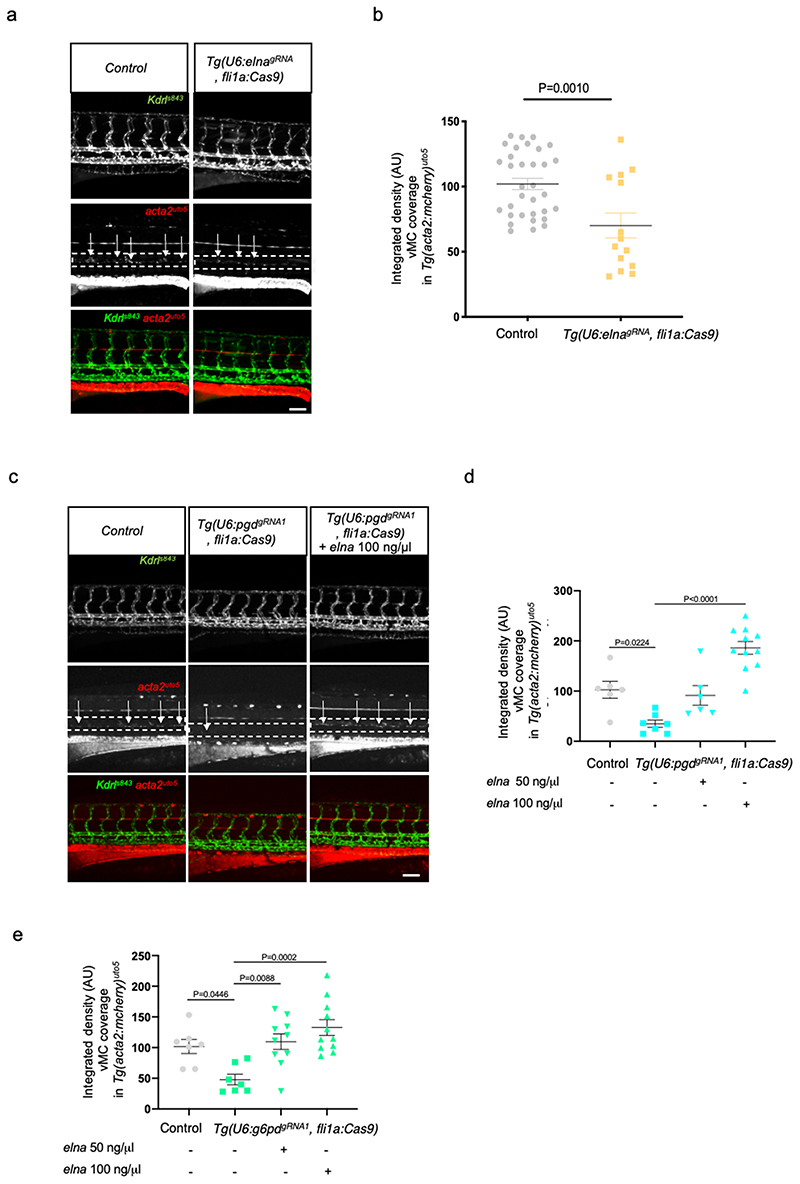
Figure 6. ELN rescue vMC recruitment in absence of functional oxPPP in EC.
a, Confocal images of partial z-projection of the trunk region (somite 8-14) of Tg(kdrl:eGFP)s843 ;Tg(acta2:mCherry)uto5 embryos at 4dpf after the injection with the Tol2 mRNA plasmid U6:elnagRNA; fli1a:Cas9 compared to control plasmid-injected embryos. Scale bar, 100 μm.
b, Scatter plots showing the quantification of vMC coverage of Tg(kdrl:eGFP)s843 Tg(acta2:mCherry)uto5 embryos at 4dpf after the injection with the Tol2 mRNA plasmid U6:elnagRNA; fli1a:Cas9 (n=14) compared to control plasmid-injected embryos (n=33) from three independent experiments. Data are shown as mean ± SEM. Statistics were done using unpaired Student’s t-test.
c, Confocal images of partial z-projection of the trunk region (somite 8-14) of
Tg(kdrl:eGFP)s843 ;Tg(acta2:mCherry)uto5 embryos at 4dpf in ctrl and in Tg(U6:pgdgRNA1, fli1a:Cas9) with and without elna mRNA injection. Scale bar, 100 μm.
d, Scatter plots showing the quantification of vMC coverage of Tg(kdrl:eGFP)s843 Tg(acta2:mCherry)uto5 embryos at 4dpf in ctrl and in Tg(U6:pgdgRNA1, fli1a:Cas9 with and without elna mRNA-injected at 50ng/μl and 100ng/μl ctrl (n=6) Tg(U6:pgdgRNA1, fli1a:Cas9)(n=7), Tg(U6:pgdgRNA1, fli1a:Cas9) elna 50ng/μl (n=6), Tg(U6:pgdgRNA1, fli1a:Cas9) elna 100ng/μl (n=11) embryos from two independent experiments. Data are shown as mean ± SEM. Statistics were done using one-way ANOVA followed by Tukey’s multiple comparison test.
e, Scatter plots showing the quantification of vMC coverage of Tg(kdrl:eGFP)s843 Tg(acta2:mCherry)uto5 embryos at 4dpf in ctrl and in Tg(U6:g6pdgRNA1, fli1a:Cas9) with and without elna mRNA-injected at 50ng/μl and 100ng/μl. ctrl (n=7), Tg(U6:g6pdgRNA1, fli1a:Cas9)(n=7), Tg(U6:g6pdgRNA1, fli1a:Cas9) elna 50ng/μl (n=10), Tg(U6:g6pdgRNA1, flila:Cas9) elna 100ng/μl (n=11) embryos from two independent experiments. Data are shown as mean ± SEM. Statistics were done using one-way ANOVA followed by Tukey’s multiple comparison test.

