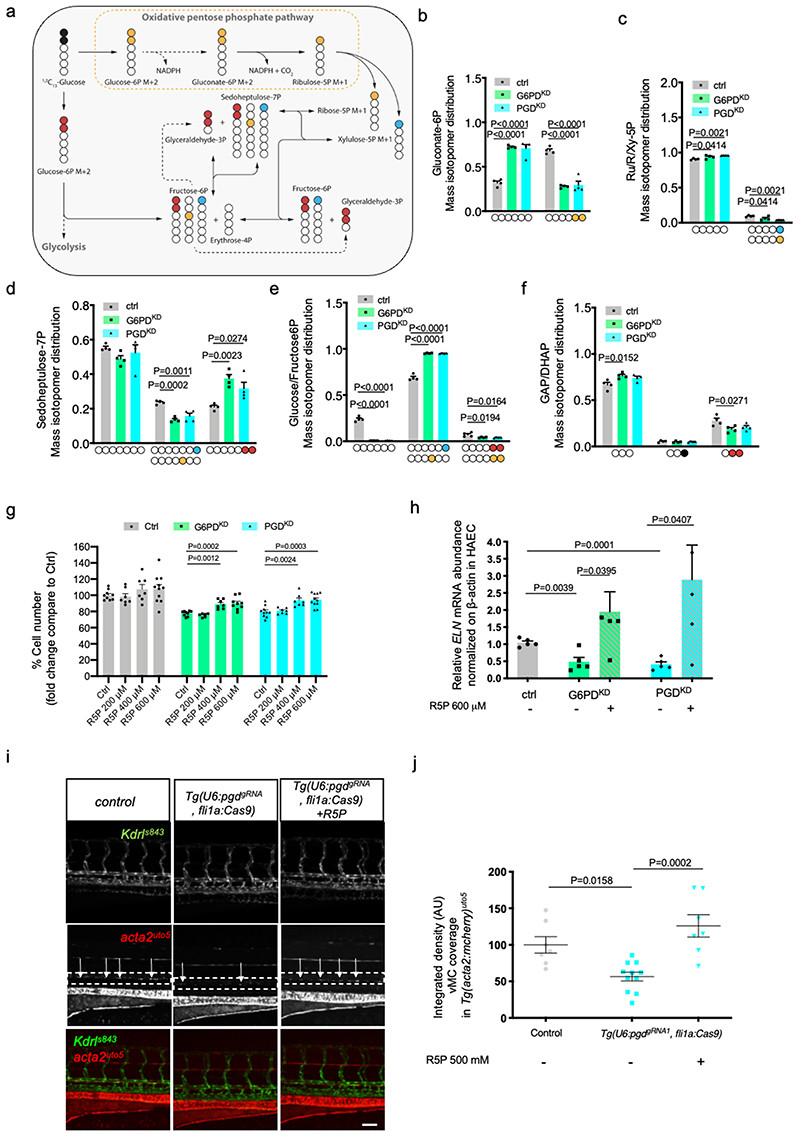
Figure 7. oxPPP-dependent R5P levels are required for EC viability, ELN expression and vMC recruitment.
a, Schematic of pentose phosphate pathway (PPP). Yellow and light blue dots represent 13 C originating from 1,2- 13 C2-glucose through the PPP, while red dots represent 13 C through glycolysis and reverse PPP.
b-f Mass isotopomer distribution (MID) of M+2 gluconate-6P (b), M+1 ribulose/ribose/xylulose-5P (c), M+1 sedoheptulose-7P (d), M+1 and M+2 glucose/fructose-6P (e), M+1 and M+2 glyceraldehyde/dihydroxyacetone phosphate (GAP/DHAP) (f). Colored carbons refer to the scheme in Fig. 7a. n=4 from one single experiment. Data are shown as mean ± SEM. Statistics were done using one-way ANOVA followed by Dunnett’s multiple comparison test.
g, Cell number assay of G6PDKD and PGDKD EC-treated with different concentration of R5P in HAEC for 72 hours compared to controls. n=8 from two independent experiments. Data are shown as mean ± SEM. Statistics were done using one-way ANOVA followed by Dunnet’s multiple comparison test.
h, qRT-PCR analysis of ELN in G6PDkd and PGDkd EC treated with 500uM of R5P. n=4 from two independent experiments. Data are shown as mean ± SEM. Statistical analysis was done using unpaired Student’s t-test.
I, Confocal images of partial z-projection of the trunk region (somite 8-14) of a Tg(kdrl:eGFP)s843 ;Tg(acta2:mCheny)uto5 zebrafish embryos at 4 dpf in ctrl and in EC-specific pgd mutants Tg(U6:pgdgRNA1, flila:Cas9) with or without injection of R5P (500 mM). Scale bar, 100 μm.
j, Scatter plots showing the quantification of vMC coverage around the DA in Tg(U6:pgdgRNA1, flila:Cas9). ctrl (n=7), Tg(U6:pgdgRNA1, fli1a:Cas9)(n=11), Tg(U6:pgdgRNA1, flila:Cas9)+R5P (n=7) embryos from two independent experiments. Data are shown as mean ± SEM. Statistical analysis was done using one-way ANOVA followed by Tukey’s multiple comparison test.

