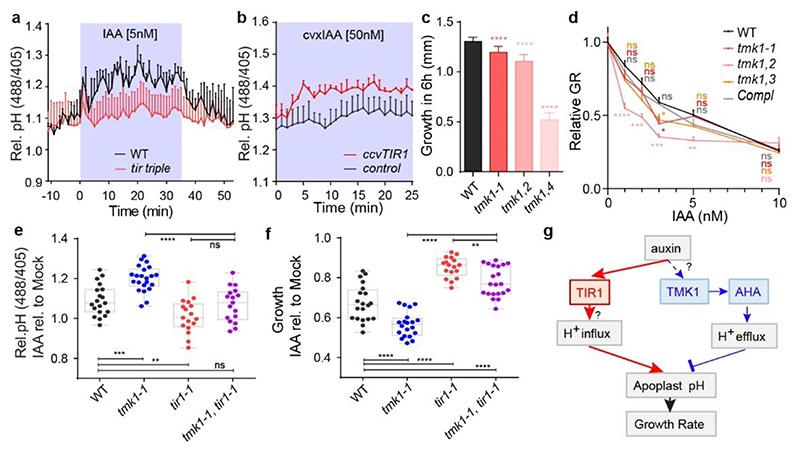
Figure 4. TIR1/AFB and TMK1 signalling converge antagonistically on apoplastic pH and growth regulation.
a, Apoplastic pH analysis by the HPTS dye shows an impaired auxin response (to 5nM IAA) in tir triple mutant roots (in red) compared to WT roots (in black) in vRootchip. Means of 3, 2 roots + SEM. p≤0.0001, Two-way ANOVA.
b, Apoplastic pH analysis by the HPTS dye shows apoplastic alkalinisation in ccvTIR1 line (in red) compared to the control line (in black) in response to cvxIAA in vRootchip. Means of 2, 3 roots + SEM. p≤0.01, from 0 - 5 minutes, Two-way ANOVA. The shaded area represents the duration of the indicated treatment.
c, Steady-state root growth over 6 hours in tmk1-related mutants. n = 6 for tmk1,4; n > 26 for others. ****p≤0.0001, One-way ANOVA.
d, Dose-response of auxin-induced root growth inhibition of tmk1-related mutants relative to WT and a complemental line (pTMK1::TMK1-FLAG in tmk1-1). Relative GR is the ratio between auxin-affected growth and mock growth for the same genotype. n > 15. *p≤0.05, **p≤0.01, ***p≤0.001, ****p≤0.0001, Welch ANOVA.
e-f, Apoplastic pH ( e ) and root growth ( f ) measurement in tmk1-1, tir1-1 and tmk1-1,tir1-1 mutants in response to 5 nM IAA. The apoplastic pH is indicated by the HPTS emission ratio after 50 minutes treatment. The root growth is measured after 6 hours. n > 16 for both graphs, ns p>0.05, **p≤0.01, ***p≤0.001, ****p≤0.0001, one-way ANOVA.
g, Model for auxin-mediated root growth regulation. Auxin induces rapid H+-influx across the PM to alkalinise the apoplast and inhibit root growth through an intracellular, non-transcriptional branch of the TIR1/AFB signalling pathway. Concomitantly, auxin through cell surface TMK1 activates H+-pumps (AHAs) to promote H+-efflux to acidify apoplast and promote growth.

