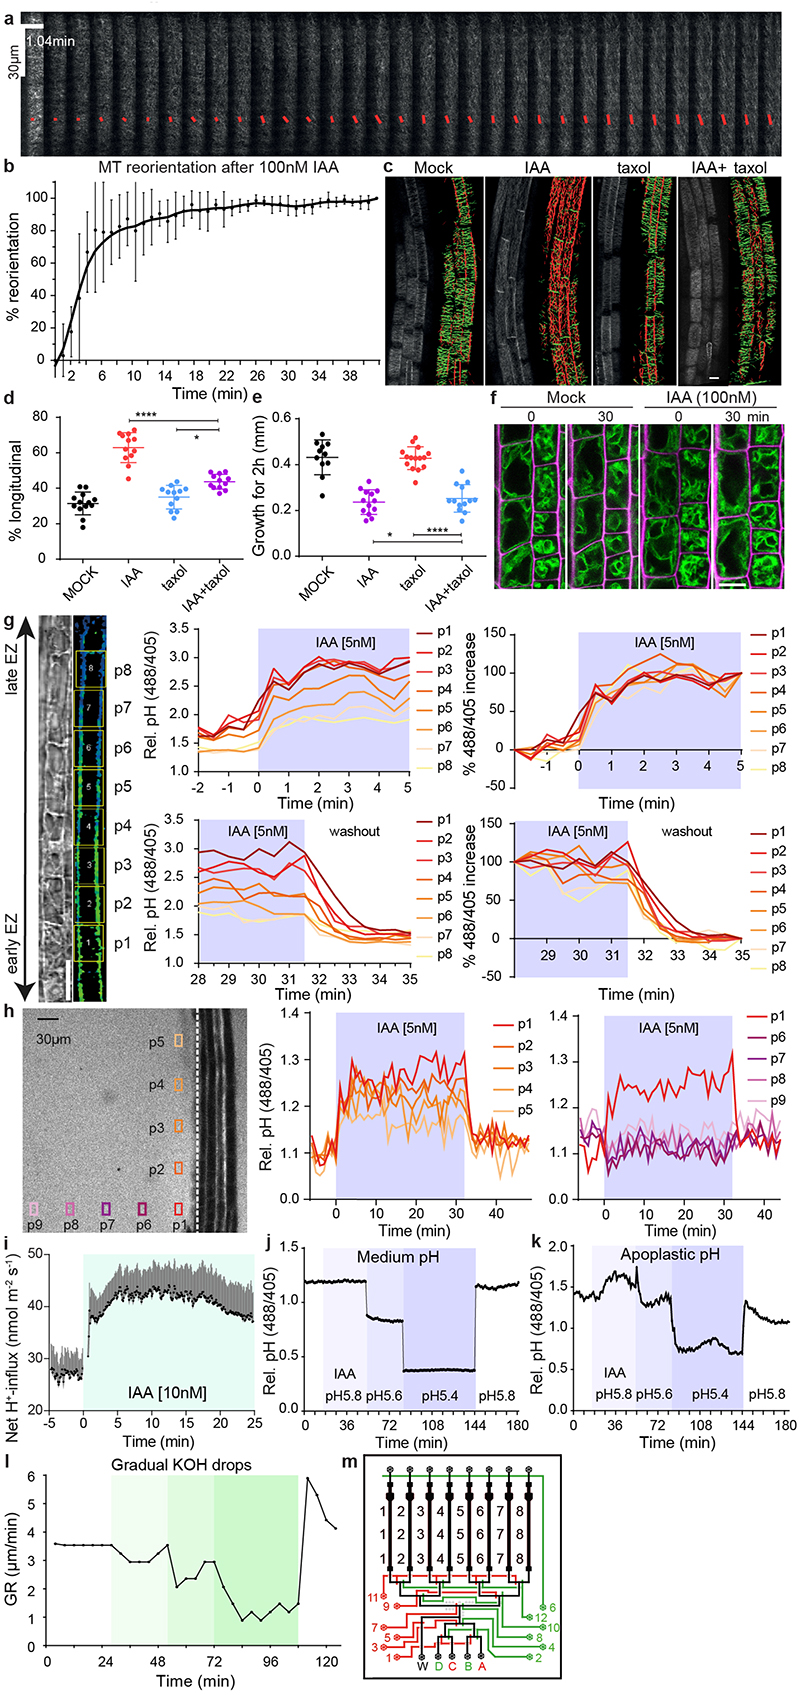
Extended Data Figure 1. Investigation of cellular mechanisms potentially involved in auxin-induced rapid root growth inhibition.
a-b, Dynamic cortical microtubule (CMT) reorientation in root cells from transversal to longitudinal in response to 100 nM IAA treatment. CMT was imaged in late elongating epidermal cells in the pEB1b::EB1-GFP marker line in vRootchip. Scans were made at 6.25 second intervals and a max Z-projection of 10 subsequent time frames was analysed using the FibrilTool macro. The average orientation of the microtubules is represented by the slope of the red line and the length of the line represents its anisotropy (a). Quantification of CMT reorientation after 100 nM IAA treatment in (a). The percentage of CMT reorientation at every time point is calculated as the difference in the angle of that time point and the initial time point divided by the difference in the angles of the initial time point and end time point at 42 minutes. Mean of 5 elongating cells, ± SD (b).
c-e, Analysis of CMT reorientation in elongating epidermal root cells (c, d) and root growth (e) of 35S::MAP4-GFP in response to 10 nM IAA, 10 μM taxol and IAA+taxol co-treatment. Orientation of CMT was analysed with the Bioline script. Green-colored CMTs mark transversal oriented CMT (angle between -45° and +45°), while red-colored CMTs indicate longitudinal orientation (angle between +45° and 135°). Scale bar = 15 μm (c). Quantification of (c) as the percentage of longitudinal CMT to total CMT detected. n > 11, One-way ANOVA (d). Growth on respective treatments for 2 hours were measured. n > 10, One-way ANOVA (e). *p≤0.05, ****p≤0.0001.
f, Vacuolar morphology tracked in the pSYP22::SYP22-YFP marker line (green signal) in the same elongating cells before and after 30 minutes of 100 nM IAA. Scale bar = 15 μm. Magenta signal indicates propidium-iodide stained cell walls.
g, Dynamics of apoplastic pH measured in different cells across the whole EZ (p1-p8) in vRootchip. The TL and blue-yellow scale image are from the same sample shown in Fig. 1a. Scale bar= 30 μm. The upper charts depict the dynamics of apoplastic pH in the indicated cells in response to 5 nM IAA, and the lower charts represent the pH in response to washout. The left two charts show the apoplastic pH measured by the HPTS dye. The right two charts show the speed at which each cell reaches its maximum pH change calculated as the difference between the pH at a given time point and the pre-stimulus pH, divided by the end pH change in that cell.
h, Dynamics of root surface pH and medium pH in vRootchip. Left graph shows the elongation zone of the root. The ROIs p1-p5 were chosen along the root, 30 μm away from the root surface indicated by the vertical white dotted line, while ROIs p6-p9 were distanced away from the root. The pH at the surface of the root (vertical positions p1-p5) increased after IAA and recovered after washout within 30 seconds. In contrast, the pH away from the root surface did not change significantly (horizontal positions p6-p9).
i, PM H+-net influx measured by a non-invasive microelectrode before and after 10 nM IAA treatment in the elongating zone of WT roots. Means of 9 roots ± SD.
j-k, The medium pH (j) and apoplastic pH (k) changed rapidly after the exchange of the medium of different pH in vRootchip. Following media were used sequentially: basal medium at pH 5.8, auxin-containing medium at pH 5.8, gradually more acidic medium of pH 5.6, followed by pH 5.4 and lastly again basal medium at pH 5.8.
l, Quantification of root growth rate in response to the gradual addition of KOH in the medium in the vRootchip. The greener the shade, the more KOH was added followed by washout with the initial basal pH 5.8 medium.
m, Scheme of the modified vRootchip adding valve 6 and with valve routes adjusted.

