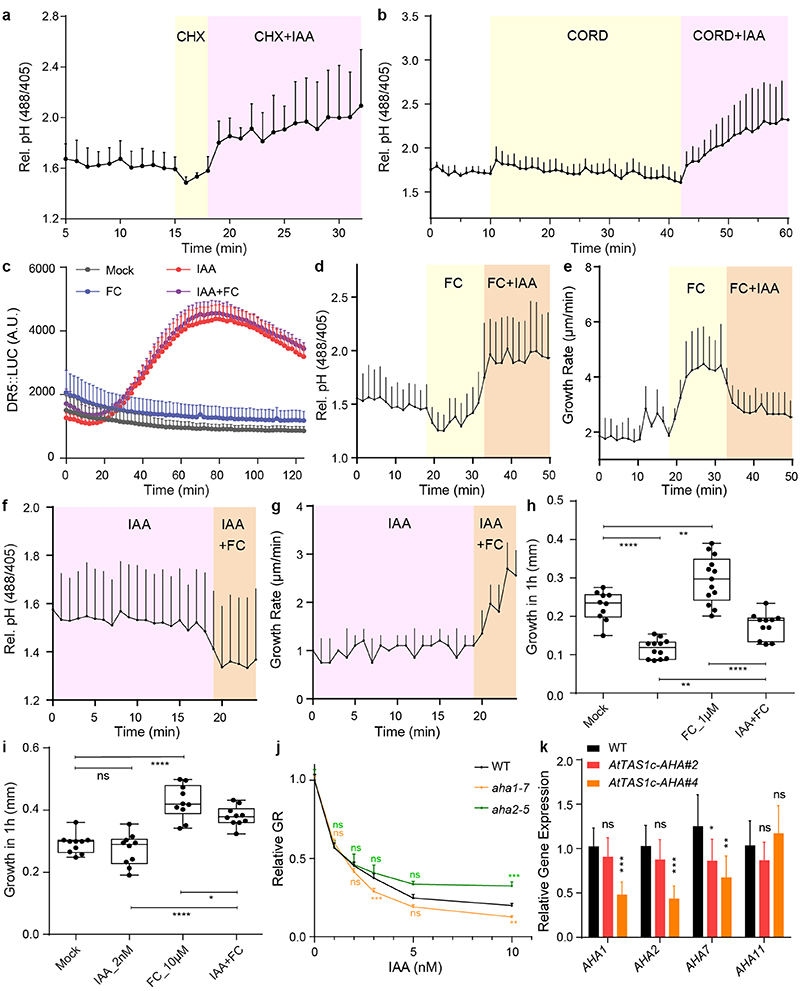
Extended Data Figure 2. H+-ATPase activation counteracts auxin-mediated apoplast alkalinisation and growth inhibition.
a, Measurement of luminescence intensity on the root tip of DR5::LUC line after 10 μM FC, 10 nM IAA and IAA+FC co-treatment. n > 3. IAA and IAA+FC are significantly different from the mock (p ≤0.0001). No significant difference between IAA and IAA+FC (p > 0.05). Two-way ANOVA.
b-g, FC and IAA counteract each other. Addition of IAA still increased apoplastic pH (b) and inhibited root growth (c) in presence of FC in vRootchip. n = 4 (b, c). Addition of FC still decreased the apoplastic pH (d) and promoted root growth (e) in presence of IAA in vRootchip. n = 4, the shaded area represents the duration time of the indicated treatments (d-e). Root growth after FC, IAA and co-treatment for 1 hour in steady state by scanner. 1 μM FC and 10 nM IAA were used in (f) while 10 μM FC and 2 nM IAA were used in (g). n > 9 for both graphs, ns p>0.05, *p≤0.05, **p≤0.01, ****p≤0.0001, One-way ANOVA (f-g).
h, Dose-response of auxin-induced root growth inhibition of aha single mutants. n > 22. Relative GR is ratio between auxin-affected growth in the mutant to mock growth for the same genotype. ns p>0.05, **p≤0.01, ***p≤0.001, Welch ANOVA.
i, Quantitative Real-time PCR on the AHA1,2,7,11 expression in root tips of AtTAS1c-AHA#2 and #4. The expression level was normalized to EF1α as housekeeping gene. Means of 3 biological replicates + SD.

