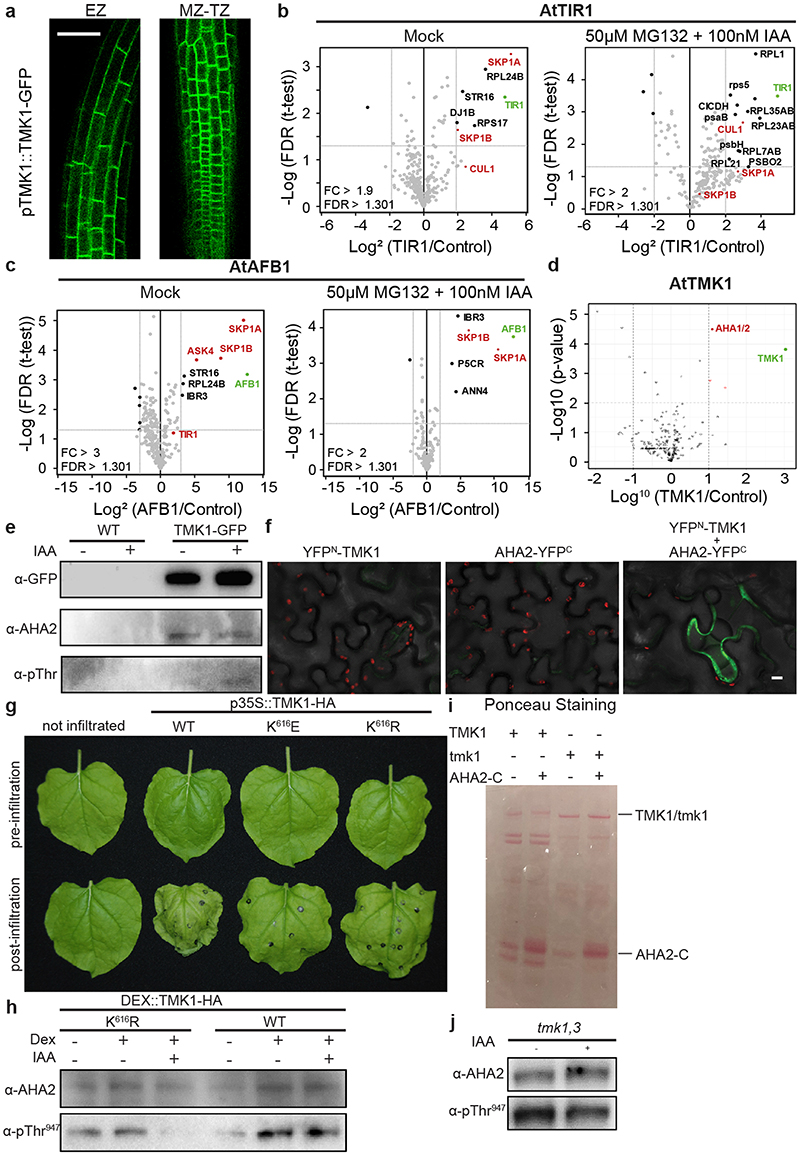
Extended Data Figure 3. TMK1 directly mediates auxin-induced H+-ATPase activation.
a, IP-MS/MS on pTIR1::TIR1-VENUS in tir1-1 and pAFB1::AFB1-VENUS in afb1-3 lines under normal condition (upper graphs) compared to 1 hour 50 μM MG132 pre-incubation and 100nM IAA treatment for 2 minutes (lower graphs). Volcano plots show fold changes (in log2 scale, x-axis) and significance (p-value, y-axis). Proteins passing the threshold of FDR 0.05 and specific fold change are marked. Green depicts the respective bait protein and red depicts known members of the SCF E3 ubiquitin ligase complex. Pulldowns were performed in triplicate, LFQ analysis.
b, IP-MS/MS on 35S::TMK1-GFP line. Volcano plot shows fold change (in log10 scale, x-axis) and significance (p-value, y-axis). Red dots are in the range of ratio > 10 and -LOG p-value > 2. P-values are calculated based on the three replicates of 35S::TMK1-GFP vs WT using a Two-sided t-test.
c, co-IP of pTMK1::TMK1-GFP roots, followed by Western blot detection of AHA2 and Thr947-phosphorylated AHA2. The interaction was not regulated by 30 minutes of 100 nM IAA treatment, but the phosphorylation state of the interacting AHA2 was increased.
d, Bimolecular Fluorescent Complementation (BiFC) in Nicotiana benthamiana leaves transiently transformed with YFPN-TMK1, AHA2-YFPC or both. Scale bar = 10μm
e, Representation of wilting leaves of Nicotiana benthamiana that transiently express the WT TMK1 and ATP-site mutated forms: p35S::TMK1-HA K616E or K616R.
f, Western blot analysis of the AHA2 levels and the Thr947 phosphorylation in roots of DEX::TMK1K616R-HA and DEX::TMK1-HA lines treated +/- DEX (30 μM for 24 hours) and +/- IAA (100 nM for 1 hour).
g-h, Western blot detection of the AHA2 levels and the Thr947 phosphorylation in tmk1,3 roots treated with 100 nM IAA for 1 hour (g). Quantification of the auxin effect on AHA2 phosphorylation in (g) by normalising the intensity ratio of pThr947 to AHA2 detected in auxin-treated roots to the same ratio in mock-treated samples of the same genotype (h).

