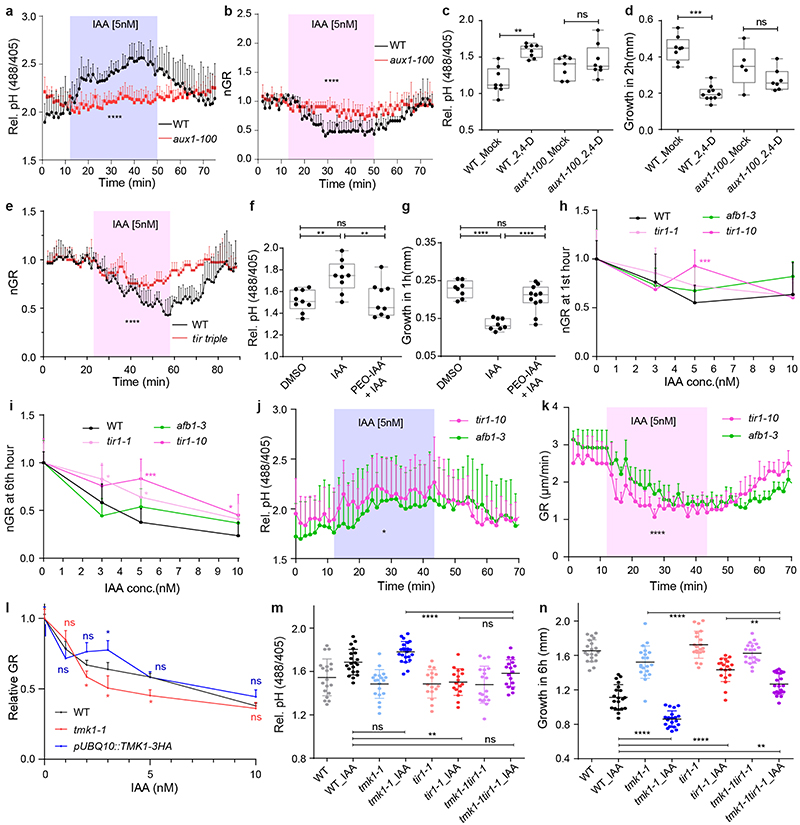
Extended Data Figure 4. TIR1/AFB and TMK1 signalling converge antagonistically on apoplastic pH and growth regulation.
a-b, Apoplastic alkalinisation (a) and root growth inhibition (b) in response to IAA measured in aux1-100 mutant compared to WT roots in vRootchip. Apoplastic pH is measured by the HPTS dye. n = 3; p ≤ 0.0001, Two-way ANOVA for both graphs.
c-d, Apoplastic alkalinisation (c) and root growth inhibition (d) in response to the synthetic auxin analogue 2,4-D in aux1-100 mutant compared to WT roots. The steady state pH with the HPTS dye was measured 30 minutes after mock or 100 nM 2,4-D treatment. n > 6, One-way ANOVA (c). The growth obtained in 2 hours was captured by scanner. n > 4, One-way ANOVA (d). ns p>0.05, **p≤0.01, ***p≤0.001.
e, Root growth of tir triple mutant (in red) compared to WT (in black) in response to 5 nM IAA in the vRootchip. n = 3, 2. p≤0.0001, two-way ANOVA.
f-g, apoplastic pH (f) and root growth (g) after 10 μM PEO-IAA and 5 nM IAA. The steady state pH was measured 30 minutes after the treatments using the HPTS dye, while the root growth obtained in 1 hour was recorded by scanning the plates. n > 7, ns p>0.05, **p≤0.01, ****p≤0.0001, One-way ANOVA.
h, Dose-response of auxin-induced root growth inhibition of pUBQ10::TMK1-3HA compared to WT and tmk1-1. Relative GR is the ratio between auxin-affected growth in a mutant to the mock growth for the same genotype. n > 7. ns p>0.05, *p≤0.05, Welch ANOVA.
i-j, Raw data for Figure 4d and e, respectively. ns p>0.05, **p≤0.01, ****p≤0.0001, One-way ANOVA.

