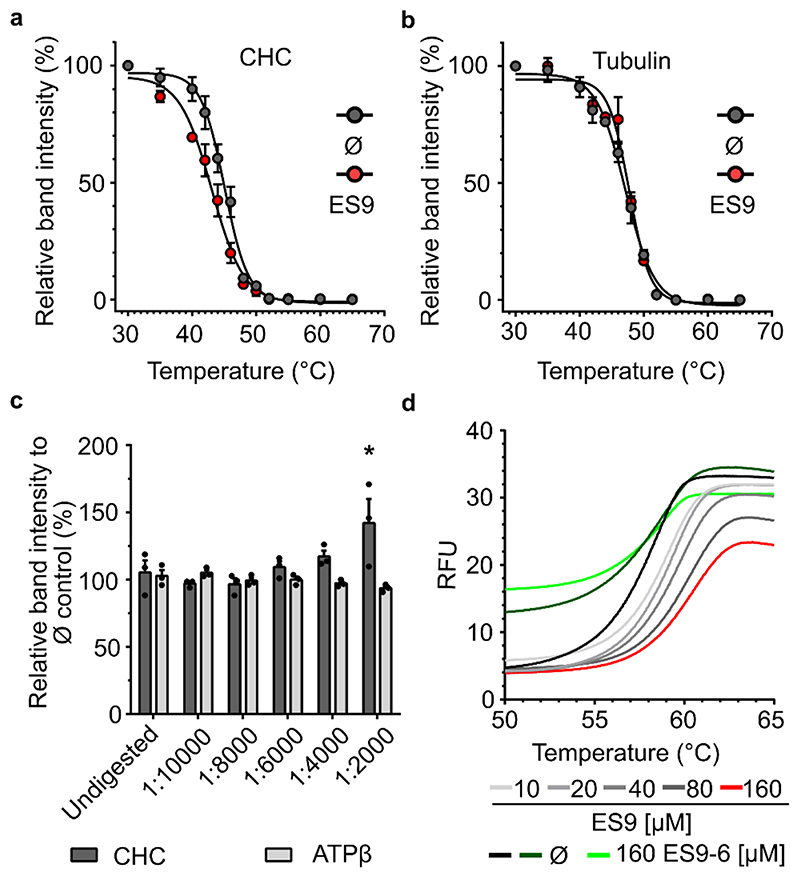
Figure 1. ES9 binds clathrin heavy chain.
(a) and (b) Protein extracts from Arabidopsis PSB-D cell cultures were treated with ES9 (250 μM) or DMSO (Ø) for 30 min and the thermal denaturation curves for endogenous clathrin heavy chain (CHC) (a) and tubulin (b) were recorded across 12 temperature points (30-65°C). The relative band intensity compared to the lowest temperature (30°C) sample was measured by Western blot with anti-CHC and anti-tubulin antibodies. Error bars in (a) and (b) indicate standard error of the mean (SEM) of three biological replicates. For the uncropped blots, see Supplementary Fig. 9. (c) Protein extracts from Arabidopsis PSB-D cell cultures were incubated with ES9 (250 μM) or DMSO (Ø) for 30 min and digested with different concentrations of pronase. An undigested sample was included as control. The relative band intensity compared to the DMSO control was measured by Western blot with anti-CHC and anti-ATP synthase subunitβ (ATPβ) antibodies. Error bars indicate SEM, individual data points are shown. *P<0.05, for a one-way analysis of variance (ANOVA) test with a Dunnett’s multiple comparisons test, and compared to the undigested control; (n=3); n, biological replicates. For the uncropped blots, see Supplementary Fig. 11. (d) Changes in the thermodynamic stability of the Arabidopsis CHC1 N-terminal domain in the presence of different concentrations of ES9 and the inactive analog ES9-6. Controls are respective to ES9 and ES9-6 treatments. The data shown are representative of three experiments. RFU, relative fluorescence units.

