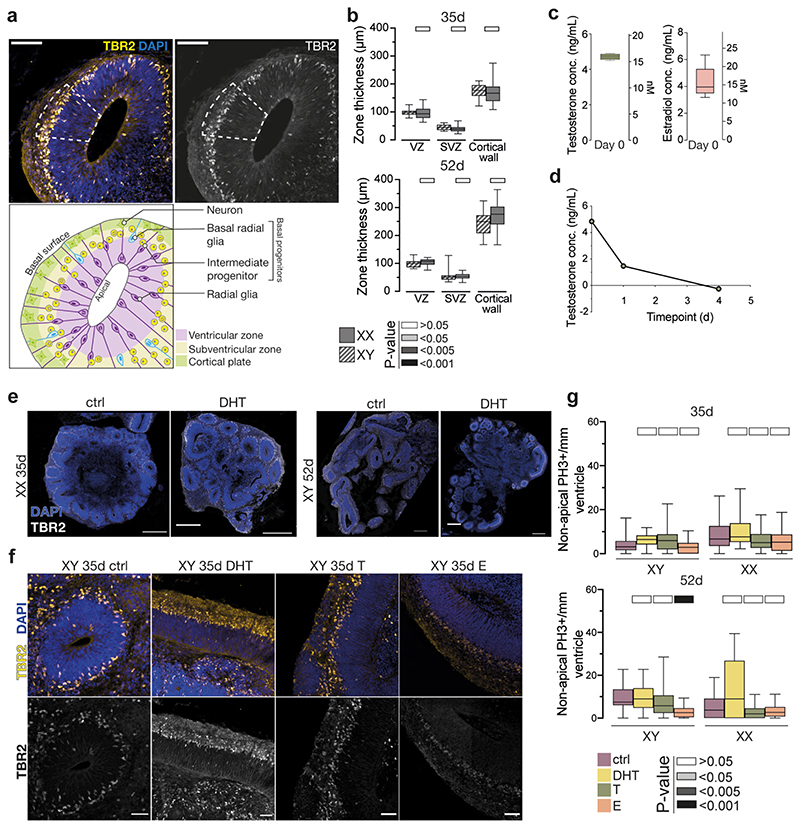
Extended Data Figure 1. Treatment and phenotypic characterization of cerebral organoids.
a) Illustration of the determination of the progenitor zone for quantifications. The progenitor zone (VZ+SVZ) was determined based on immunostaining and histological landmarks (see Methods). Immunostaining of XX 35d organoids stained for TBR2 (yellow, white), co-stained with DAPI (blue). Dashed line indicates the progenitor zone. Schematic of an organoid ventricle with different progenitor populations of interest. b) Quantification of thicknesses of different morphological zones between male (XY) and female (XX) brain organoids at 35d (above) and 52d (below). Significance values (Mann-Whitney, two tailed) of the measurements from XX organoids, as compared to XY organoids, are indicated by different shades of grey. VZ-ventricular zone, SVZ-subventricular zone. c) Actual measured concentration of testosterone (left) and estradiol (right) in the media after the addition of 100nM (calculated) on day 0, as measured by ELISA assay. d) Actual measured concentration of testosterone over 4 days of organoid culture after addition of 100nM (calculated) on day 0, as measured by ELISA. e) Sections of whole XX organoids at 35d (left), and XY organoids at 52d (right), stained for TBR2 (white). Co-stained with DAPI (blue). f) XY 35d organoids stained for TBR2 (yellow, white), co-stained with DAPI (blue), treated with DHT, T or E. g) Quantification of non-apical mitotic, PH3+ cells in XY and XX, 35d and 52d organoids, treated with DHT, T and E. Scale bars: e) 500μm, a), f) 100 μm. See Methods for details of statistics and Supplementary Table 5 for details of n numbers.

