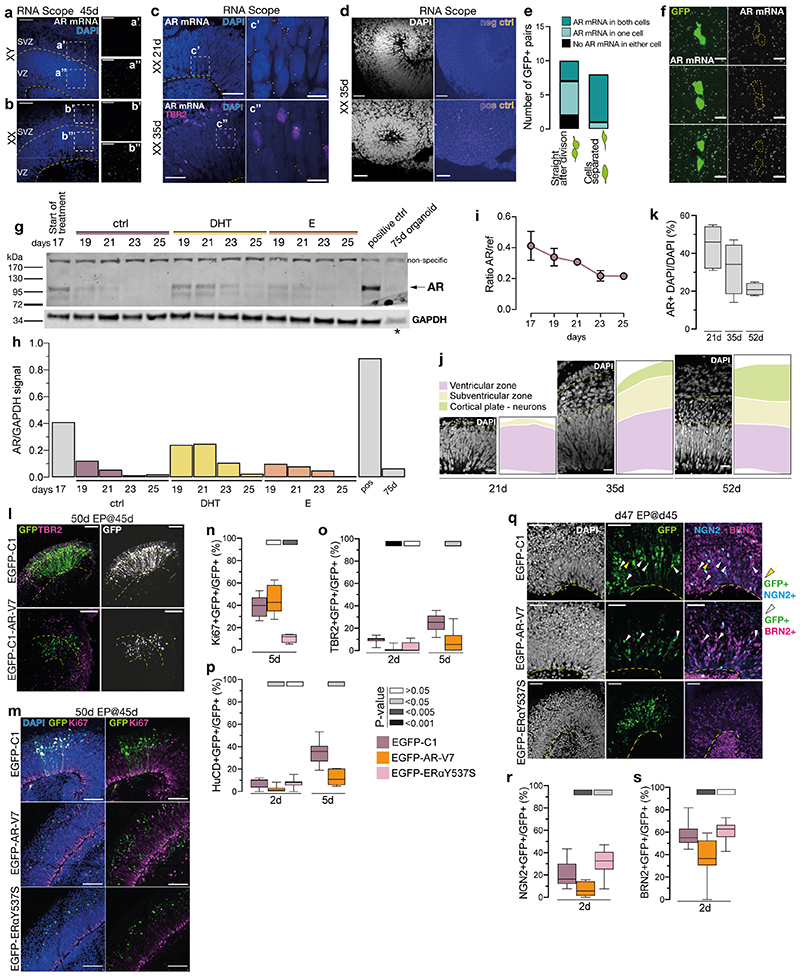
Extended Data Figure 4. Androgen receptor activity in radial glia promotes their proliferation rather than differentiation.
a) RNA Scope (fluorescent in situ) for AR of XY organoids at 45d. Single AR mRNA puncta (white). Co-stained with DAPI (blue). Yellow dashed lines demarcate ventricular zone (VZ) and the subventricular zone (SVZ). a’) Portion of the VZ from a. a”) Portion of the SVZ from a. b) RNA Scope for AR of XX organoids at 45d. Single AR mRNA puncta (white). Co-stained with DAPI (blue). b’) Portion of the VZ from b. b”) Portion of the SVZ from b. Note the difference in the amount of AR mRNA in the VZ and SVZ in both cell lines. c) RNA Scope for AR of XX 21d (top) and 35d (bottom) organoids. Single AR mRNA puncta (white). Immunostaining for TBR2 (magenta). Co-stained with DAPI (blue). Yellow dashed line demarcates the apical surface c’) Portion of the ventricular zone (VZ) from XX 21d organoid. c”) Portion of the VZ from XX 35d organoid. d) RNA Scope negative (above) and positive (below) control (fire look up table) in female (XX) 35d organoids. DAPI is in white. e) Quantification of AR mRNA distribution in GFP+ pairs of cells, depending on the stage of cell division. f) RNA Scope of androgen receptor (AR) mRNA (white puncta), together with GFP signal (green) from EmGFP Sendai Fluorescence Reporter showing examples of three daughter cell pairs. Yellow dashed lines indicate GFP+ cell body. g) Western blot for AR on control, DHT and E treated organoids at 17-25 days. AR specific band is predicted to be ~110kDa. Note the increased AR signal in DHT-treated organoids. Asterisk indicates a lower amount of protein loaded for the 75d organoid lane (see Methods). For gel source data, see Supplementary Figure 1. h) Quantification of levels of AR protein from g), normalised by GAPDH expression. i) ddPCR results showing the decrease in AR transcription between days 17 and 25. ref = housekeeping gene EIF2B2. j) Representative images of the cortical wall at 21, 35 and 52d, with DAPI-labelled nuclei visible, showing the relative reduction in the radial glial progenitor layer (ventricular zone - VZ) and an increase in the thickness of the neuronal layer over time. k) Quantification of the percentage (%) of cells (AR+ DAPI), containing AR mRNA puncta (as detected by RNA Scope), out of all cells (DAPI) at 21, 35 and 52d. Cells counted: 21d – 1222, 35d – 1067, 52d – 1201. Co-stained with DAPI (white). l) XX organoids electroporated (EP) at 45d and fixed at 50d. EGFP-C1: control; EGFP-C1-AR-V7: constitutively active AR. Immunostaining for GFP and TBR2. Yellow dashed lines demarcate the apical and basal boundaries of the VZ. Note increased GFP+ nuclei in the VZ in EGFP-C1-AR-V7. m) Immunostaining for GFP (green) and Ki67 (magenta) on XX 50d organoids, electroporated at 45d. Co-stained with DAPI (blue). EGFP-C1: control plasmid; EGFP-C1-AR-V7: plasmid expressing constitutively active AR; EGFP-C1-ERaY537S: plasmid expressing constitutively active ERa. n) Quantification of the proportion of GFP+ cells co-staining for the proliferation marker Ki67 at 5 days post electroporation in XX organoids electroporated with the indicated plasmid at 45d. o) Quantification of the proportion of GFP+ cells co-staining for the intermediate progenitor marker TBR2 at 2- and 5 days post electroporation in XX organoids electroporated at 45d. At 5 days post electroporation, most cells electroporated with EGFP-C1-ERaY537S died indicating a later effect on cell survival. p) Quantification of the proportion of GFP+ cells co-staining for the neuronal marker HuC/D 2- and 5 days post electroporation in XX organoids electroporated at 45d. At 5 days post electroporation, most cells electroporated with EGFP-C1-ERaY537S died. q) XX 47d organoids, electroporated at 45d. Immunostaining for GFP (green), NGN2 (cyan) and BRN2 (magenta). Co-stained with DAPI (white). Yellow arrowheads: GFP+/NGN2+ cells. White arrowheads: GFP+/BRN2+ cells. Yellow dashed line demarcates the apical surface. Note the increased expression of differentiation markers upon expression of ERaY537S perhaps indicating a premature cell cycle exit and relating to the cell death observed. r) Quantification of the proportion of GFP+ cells co-staining for the neurogenic marker NGN2 2 days post electroporation in XX organoids electroporated at 45d. s) Quantification of the proportion of GFP+ cells co-staining for the upper layer neurogenesis marker BRN2 2 days post electroporation in XX organoids electroporated at 45d. Scale bars: a), b), l), m) 50μm, c), d), q) 25μm, a’), a”), b’), b”), j) 20μm, c’), c”), f) 5μm. See Methods for details of statistics and Supplementary Table 5 for details of n numbers.

