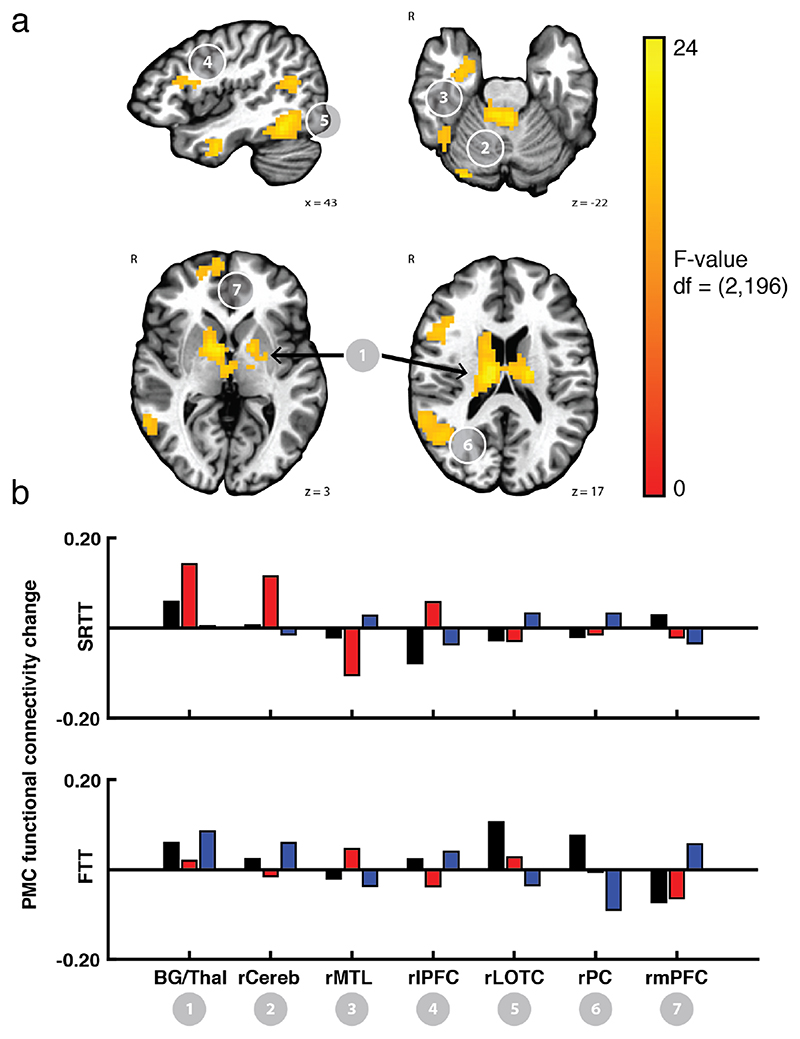
Figure 5.
Difference in PMC functional connectivity due to training across the feedback valence groups depends on the task being performed. Upper. Data from both tasks were submitted to a linear mixed effects model. This analysis revealed the resulting F-statistic map for the interaction term ‘Task*Feedback valence*Rest’ indicating regions within the basal ganglia, cerebellum, MTL, temporal cortex, parietal cortex, and prefrontal cortex showed an effect of feedback on functional connectivity change after training that varied by task. Mean PMC functional connectivity change after training from these ROIs is shown in the lower panel. Importantly, all ROIs that showed an overlap in Figure 4 also showed the interaction in the LME analysis. Bars showing mean connectivity change across voxels in the identified cluster after training estimated by the linear mixed effects model are included to enable qualitative comparison.

