. 2021 Sep 22;12(2):416–431. doi: 10.1158/2159-8290.CD-20-1201

Figure 4.

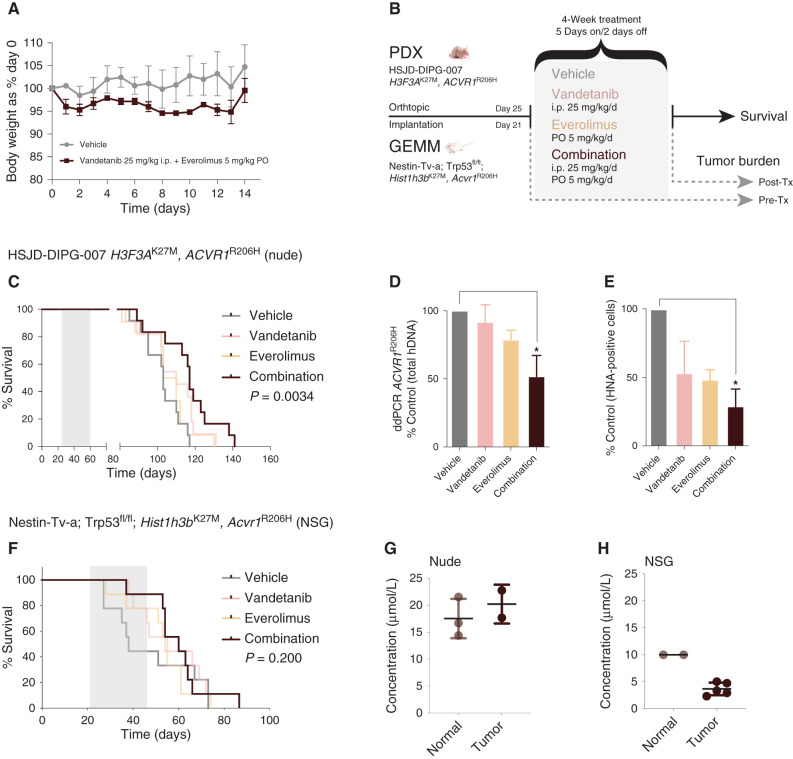
Figure 4. Efficacy of combined vandetanib and everolimus in vivo. A, Tolerability in NOD.SCID mice exposed to daily oral treatment with the combination of vandetanib and everolimus over 14 days, as assessed by body weight relative to day 0. Mean and SD of three mice per group are plotted. PO, oral administration. B, Schema for in vivo efficacy (survival) and tumor burden experiments in orthotopic PDX and GEMM allografts of mutant ACVR1-driven DIPG. Tx, treatment. C, Survival curves for mice (n = 16–22 per group) bearing HSJD-DIPG-007 orthotopic xenografts, treated with vandetanib (pink), everolimus (light orange), or the combination (dark red), compared with vehicle-treated controls (gray). D, Bar plot quantifying tumor burden as assessed by ddPCR for ACVR1R206H in mice treated with vandetanib (pink), everolimus (light orange), or the combination (dark red), expressed as a percentage of vehicle-treated controls (gray). E, Bar plot quantifying cellularity by human nuclear antigen (HNA)–positive cells in mice treated with vandetanib (pink), everolimus (light orange), or the combination (dark red), expressed as a percentage of vehicle control (gray). Mean and SD plotted. *, P < 0.05, adjusted t test. F, Survival curves for mice (n = 16–22 per group) bearing Nestin-Tv-a; Trp53fl/fl; Hist1h3bK27M, Acvr1R206H orthotopic allografts, treated with vandetanib (pink), everolimus (light orange), or the combination (dark red), compared with vehicle-treated controls (gray). G, Dot plot of vandetanib concentration in the normal brains and engrafted tumors of nude mice treated with combined vandetanib and everolimus, as assessed by mass spectrometry. The black horizontal line represents the median. H, Dot plot of vandetanib concentration in the normal brains and engrafted tumors of NSG mice treated with combined vandetanib and everolimus, as assessed by mass spectrometry. The black horizontal line represents the median.

Efficacy of combined vandetanib and everolimus in vivo. A, Tolerability in NOD.SCID mice exposed to daily oral treatment with the combination of vandetanib and everolimus over 14 days, as assessed by body weight relative to day 0. Mean and SD of three mice per group are plotted. PO, oral administration. B, Schema for in vivo efficacy (survival) and tumor burden experiments in orthotopic PDX and GEMM allografts of mutant ACVR1-driven DIPG. Tx, treatment. C, Survival curves for mice (n = 16–22 per group) bearing HSJD-DIPG-007 orthotopic xenografts, treated with vandetanib (pink), everolimus (light orange), or the combination (dark red), compared with vehicle-treated controls (gray). D, Bar plot quantifying tumor burden as assessed by ddPCR for ACVR1R206H in mice treated with vandetanib (pink), everolimus (light orange), or the combination (dark red), expressed as a percentage of vehicle-treated controls (gray). E, Bar plot quantifying cellularity by human nuclear antigen (HNA)–positive cells in mice treated with vandetanib (pink), everolimus (light orange), or the combination (dark red), expressed as a percentage of vehicle control (gray). Mean and SD plotted. *, P < 0.05, adjusted t test. F, Survival curves for mice (n = 16–22 per group) bearing Nestin-Tv-a; Trp53fl/fl; Hist1h3bK27M, Acvr1R206H orthotopic allografts, treated with vandetanib (pink), everolimus (light orange), or the combination (dark red), compared with vehicle-treated controls (gray). G, Dot plot of vandetanib concentration in the normal brains and engrafted tumors of nude mice treated with combined vandetanib and everolimus, as assessed by mass spectrometry. The black horizontal line represents the median. H, Dot plot of vandetanib concentration in the normal brains and engrafted tumors of NSG mice treated with combined vandetanib and everolimus, as assessed by mass spectrometry. The black horizontal line represents the median.