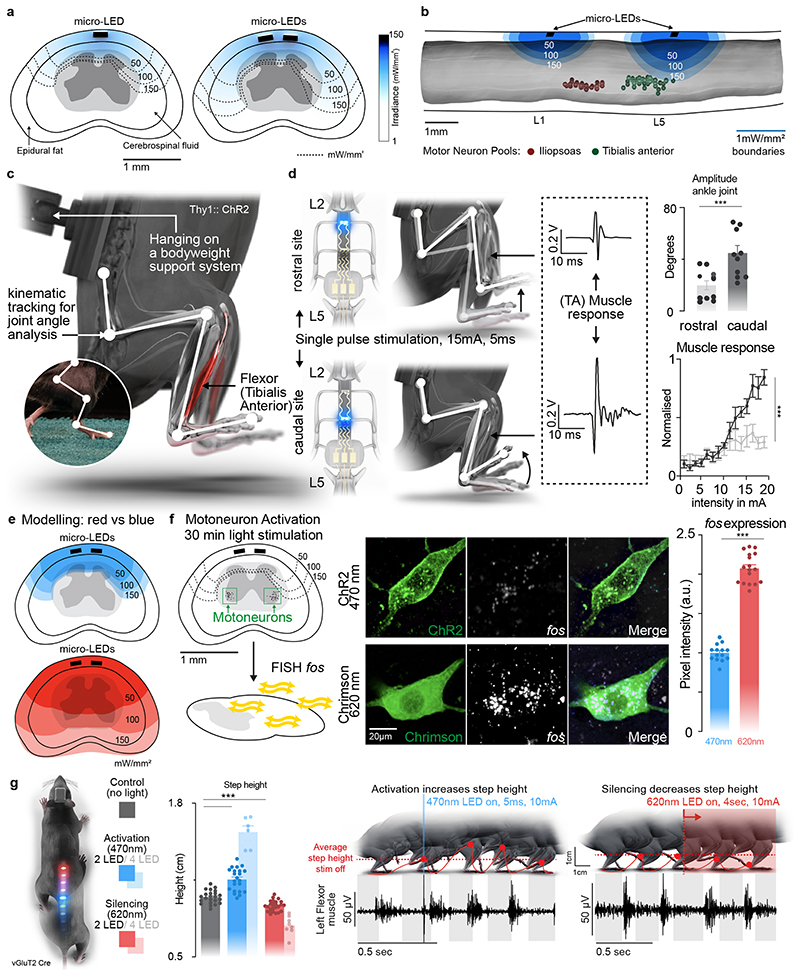
Fig. 3. Targeted photostimulation across the entire spinal cord.
a, Simulations showing the penetration of blue light depending on the location of the micro-LED along the mediolateral direction.
b, Simulations predicting the optimal rostrocaudal location of the micro-LED to target activation to tibialis anterior and iliopsoas motoneurons; whose location was identified with intramuscular rabies injections.
c, Experimental setup to measure leg kinematics and muscle responses following targeted photostimulation of the lumbar spinal cord in Thy1-ChR2 mice.
d, Reconstructed leg movements and muscle responses following one pulse photostimulation delivered over the rostral versus caudal lumbar spinal cord. The bar plot reports the mean range of motion induced by the photostimulation (n = 10 mice, two-sided unpaired t-test, ***, p = 0.0021, meanmean±s.e.m.). The plot reports the area under the curve (AUC) of rectified muscle responses following photostimulation (n = 5 mice, ANOVA, ***, p < 0.0001, mean±s.e.m.)
e, Simulations reporting the attenuation of blue (470nm) versus red-shifted (620nm) photostimulation through spinal tissues.
f, Photographs showing the expression of the immediate early gene fos in motoneurons expression ChR2 or Chrimson following blue (470nm) versus red-shifted (620nm) photostimulation. Bar plots reporting the relative expression of fos mRNA following blue (470nm) versus red-shifted (620nm) photostimulation (n=14 /17 motoneurons for 470nm/620nm stimulation, n= 3 mice per group, two-sided unpaired t-test ***, p <0.0001, mean±s.e.m.).
g, Mice expressing ChR2 (470nm) and Jaws (600nm) in vGluT2 ON neurons are stepping on a treadmill while receiving pulses of blue (470nm, 2 LEDs) versus red-shifted (620nm, 2LEDs) photostimulation. Reconstructions of leg movements including foot trajectories and concomitant activity of the tibialis anterior muscles; shaded and empty boxes correspond to stance and swing phases, respectively. Bar graph reporting the step height for each condition (n > 30 steps per condition, n = 2 mice for 2 LEDs 470nm, n = 6 mice for 4 LEDs 470nm, n = 2 mice for 2 LEDs 620nm, n = 8 mice for 4 LEDs 620nm, one-way ANOVA, ***, p < 0.0001, mean±s.e.m.). Shaded bars represent mice that expressed a single opsin over the entire lumbar spinal cord and were activated with 4 LEDs.

