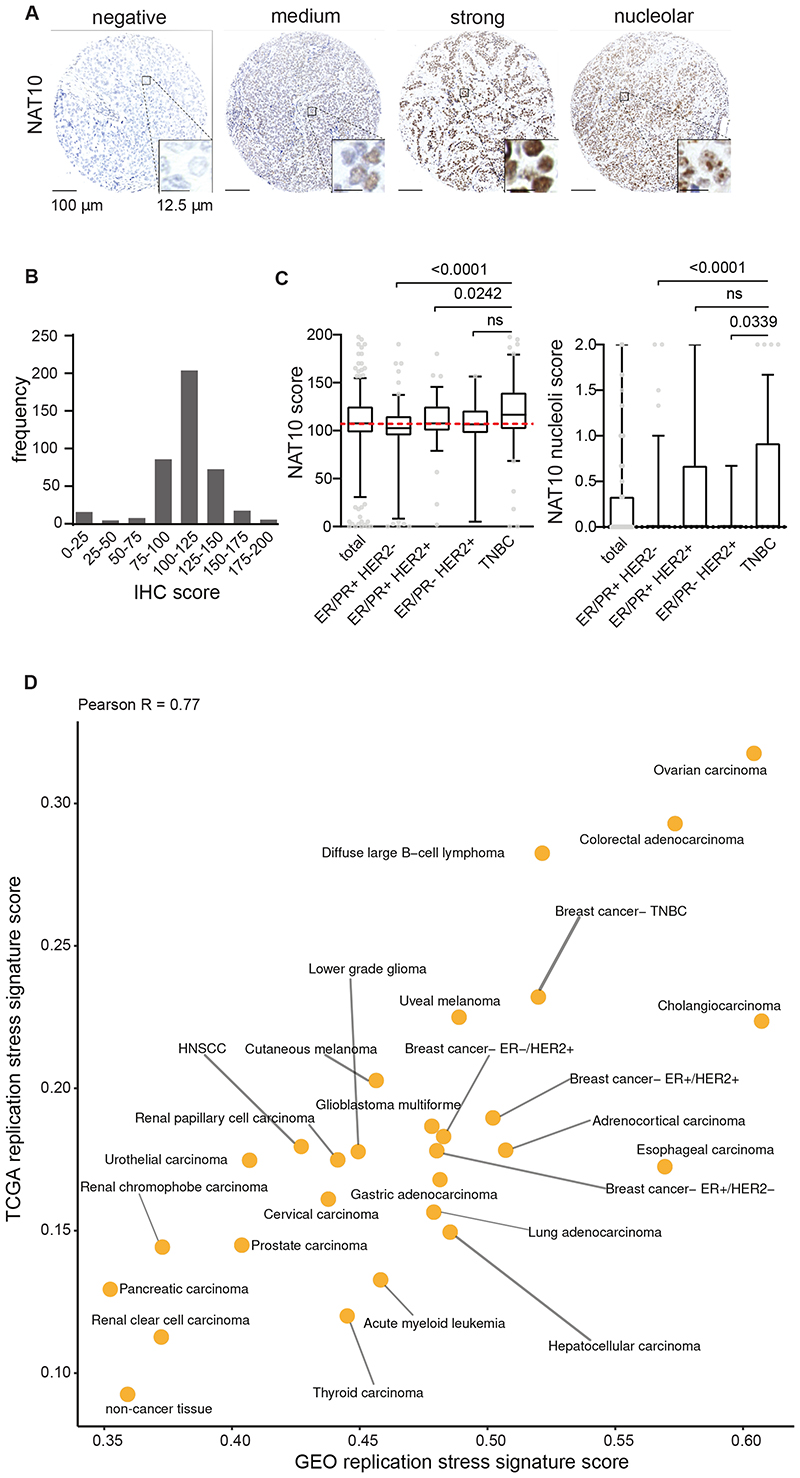
Figure 4. Immunohistochemical analysis of NAT10 in breast cancer patients and the landscape of oncogene-induced replication stress across cancer types.
(A) Representative staining of NAT10 in breast cancer patient samples (n=410). Scale bar represents 100 μm. (B, C) Patients from the combined cohort (n=410) and breast cancer subgroups ER/PR+HER2- (n=164), ER/PR+HER2+ (n=95), ER/PR-HER2+ (n=21) and TNBC (n=130) were analyzed. Tumor tissue was immunohistochemically scored for expression of NAT10 and NAT10 nucleoli. indicated P values were calculated using Mann-Whitney U test. Interquartile ranges are displayed, dashed red line represents the median score from the combined cohort and outliers are shown as dots. (D) Scatter plot of replication stress signature for 27 cancer types as well as non-cancerous tissues of patient samples from TCGA (y axis) and GEO (x axis).

