Figure 1.
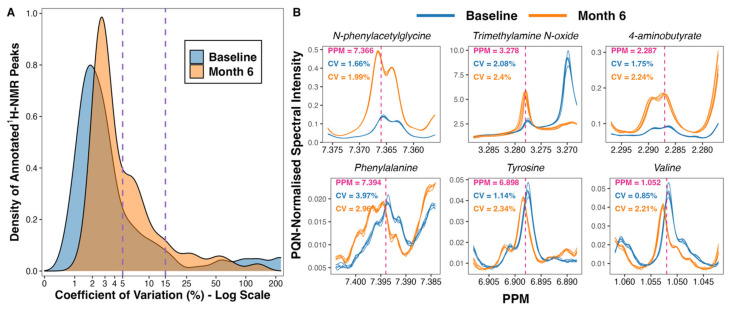
Variance in peak intensity amongst baseline (n = 5) and month 6 (n = 5) pooled samples included as internal quality controls. (A) Density plot outlining the distribution of coefficient of variation values for PQN-normalised peak intensity of annotated 1H-NMR peaks (n = 208). The percentage coefficient of variation was calculated as follows for each peak: (standard deviation of peak intensity/mean peak intensity) × 100. Calculations were performed separately for baseline and for month 6 pooled samples. The x-axis was log-transformed using the ‘log1p’ transformation from the R package scales [25]. The vertical dashed lines demarcate coefficient of variation values of 5% and 15%. (B) Plots of PQN-normalised spectra of pooled samples for certain peaks found to be changed by CSM by multivariate analysis. Plots were generated using the function ‘ROIplot’ from the R package speaq [26]. The vertical dashed lines outline the PPM shift for each peak on the x-axis. Coefficient of variation values for baseline (blue) and for month 6 (orange) pooled samples are superimposed on the plots. 1H-NMR, proton nuclear magnetic resonance spectroscopy; CV, coefficient of variation (%); PPM, parts per million chemical shift relative to TSP-d4; PQN, probabilistic quotient normalization.

