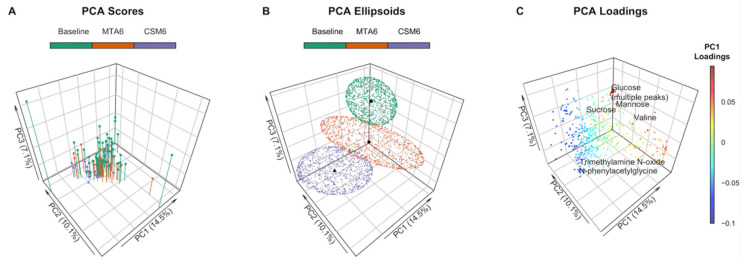
Figure 2.
Principal component analysis (PCA) of PQN-normalised urinary 1H-NMR peaks for all available samples (n = 97). Number of samples by group: baseline, n = 54; CSM6, n = 19; MTA6, n = 24. The first three principal components are presented, with percentages of the total variance explained by each of these principal components outlined in the axis titles. PCA scores and ellipsoids are stratified by study groups. Baseline samples from the CSM and MTA arms were considered together. (A) PCA scores. PCA scores are indicated by the points, vertical lines outline the x-y location of points; (B) PCA ellipsoids. PCA ellipsoid points were calculated using the function ‘makeEllipsoid’ from the R package ChemoSpec [27], and are presented to more clearly delineate discrete clustering between groups of samples. Centroids (mean PCA scores) are highlighted for the three groups of samples by black points; (C) PCA loadings with selected peaks labelled. Points are coloured according to loading values along principal component 1. CSM6, month 6 samples from CSM group; MTA6, month 6 samples from MTA group; PC, principal component; PCA, principal component analysis; PQN, probabilistic quotient normalization.

