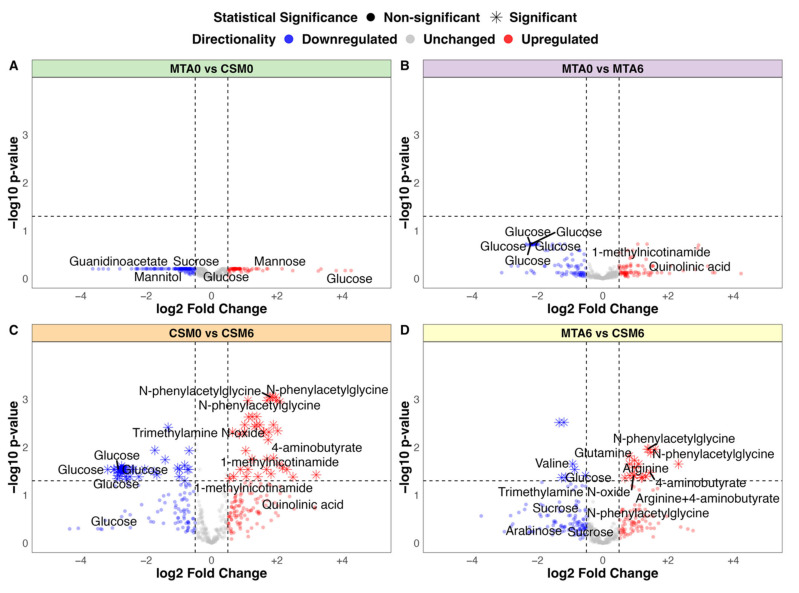
Figure 3.
Volcano plots of between-group fold change differences in urinary 1H-NMR peaks (all available samples). (A) MTA0 (n = 28) vs. CSM0 (n = 26); (B) MTA0 (n = 28) vs. MTA6 (n = 24); (C) CSM0 (n = 26) vs. CSM6 (n = 19); (D) MTA6 (n = 24) vs. CSM6 (n = 19). Log2 fold change values and adjusted p-values were derived from unpaired t-tests of between-group differences in peak intensity. Log2 fold change is presented on the x-axis with –log10 transformation of the multiplicity-corrected (Benjamini–Hochberg) p-value for between-group differences on the y-axis. Log2 fold change values and adjusted p-values derived from univariate testing of the CSM0 vs. CSM6 and MTA6 vs. CSM6 comparisons are also summarised in Table 3. A selection of the most strongly changed peaks for each comparison are labelled with metabolite annotations. Dots are coloured by directionality of change: blue = downregulated (log2 fold change < −0.5); grey = unchanged (log2 fold change > −0.5 and < 0.5); red = upregulated (log2 fold change > 0.5). Horizontal and vertical lines demarcate thresholds used to define metabolites with strong between-group changes: log2 fold change values of −0.5 and 0.5, as well as a −log10 p-value of 1.3 (corresponding to an absolute p-value of 0.05). CSM0, baseline samples from CSM group; CSM6, month 6 samples from CSM group; MTA0, baseline samples from MTA group; MTA6, month 6 samples from MTA group.

