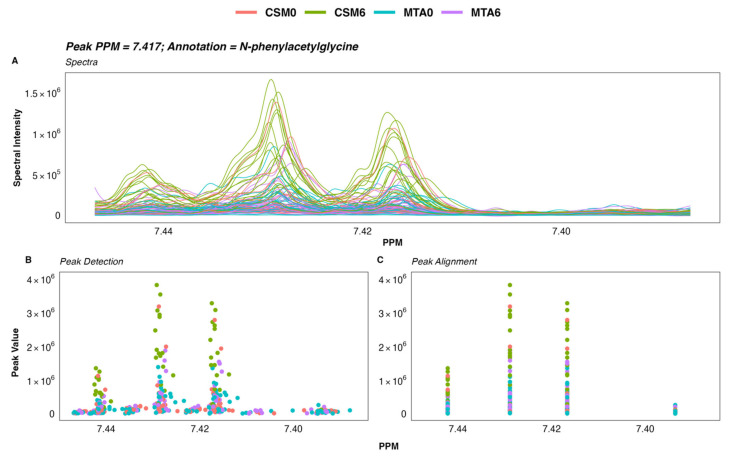
Figure 9.
Raw spectra and spectral processing of a selected urinary 1H-NMR spectroscopy peak. (A) Raw 1H-NMR spectra of a selected N-phenylacetylglycine peak. Each line corresponds to the spectrum of a single sample. (B) Detection of peaks within the spectra using a Mexican hat wavelet transformation. Each dot represents peak intensity for a single sample. (C) Alignment of peaks by grouping to account for shifts in peaks between spectra due to differences in sample environment and/or experimental conditions. Each dot represents peak intensity for a single sample. Manual inspection of the spectra and spectral processing in speaq was performed as outlined here for peaks identified as important to classification performance by multivariate models to ensure that between-group differences in the identified peaks were not artefactual and could be reliably identified in the spectra. 1H-NMR spectroscopy, proton nuclear magnetic resonance spectroscopy; CSM, combined metabolic surgery plus medical therapy; CSM0, baseline samples from the CSM group; CSM6, month 6 samples from the CSM group; MTA, medical therapy alone; MTA0, baseline samples from the MTA group; MTA6, month 6 samples from the MTA group; PPM, parts per million chemical shift relative to TSP-d4.

