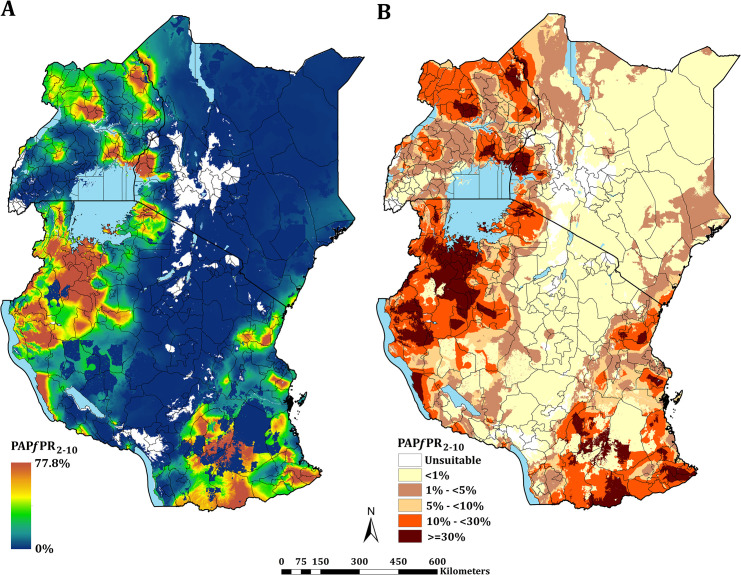
Fig 3. Predicted mean PAPfPR2-10 at 1 × 1 km spatial resolution maps in 2019.
(A) mean prevalence (continuous stretched scale), and (B) Classified mean of the endemicity. The white represents the climatic unsuitability for transmission (TSI = 0). PAPfPR2–10 predictions are shown for areas within the stable limits of transmission.

