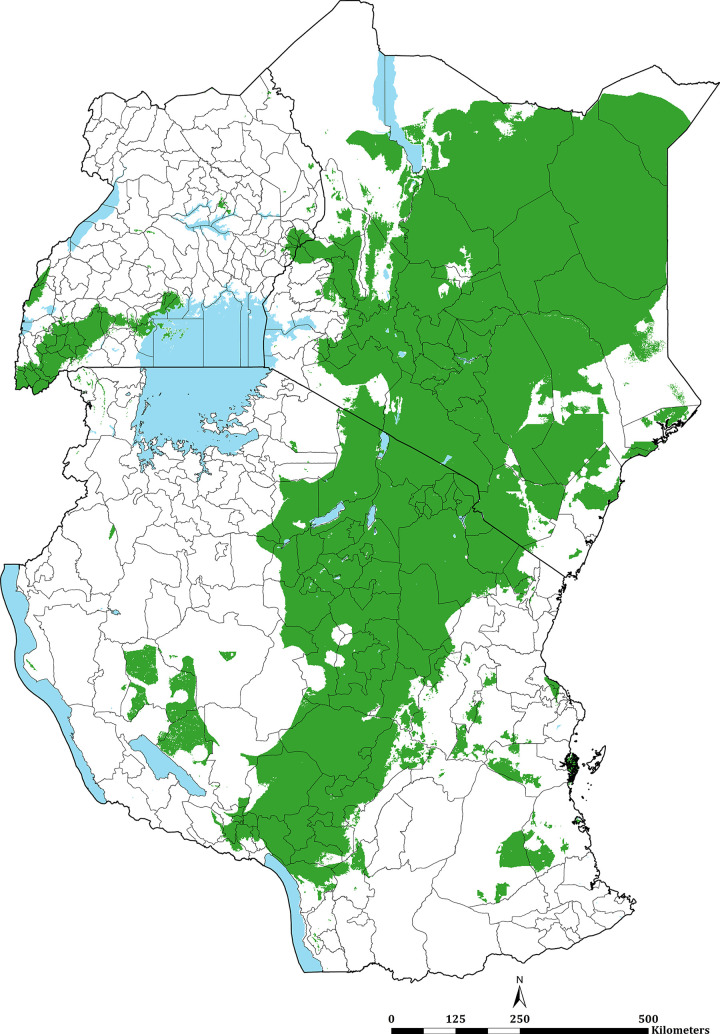
Fig 5. Non-exceedance probability (NEP) maps for 2019.
PAPfPR2-10 predictions are 90% certain to be < 1%, shown in green. Derived from the fitted spatiotemporal model, formally expressed as: NEP = (Prob PAPfPR2–10 (x, t) < l|Data); where l is the prevalence threshold. A NEP close to 100% indicates that PAPfPR2–10 is highly likely to be below the threshold l; if close to 0%, PAPfPR2–10, is highly likely to be above the threshold l; if close to 50%, PAfPR2–10, is equally likely to be above or below the threshold l, hence corresponding to a high level of uncertainty.

