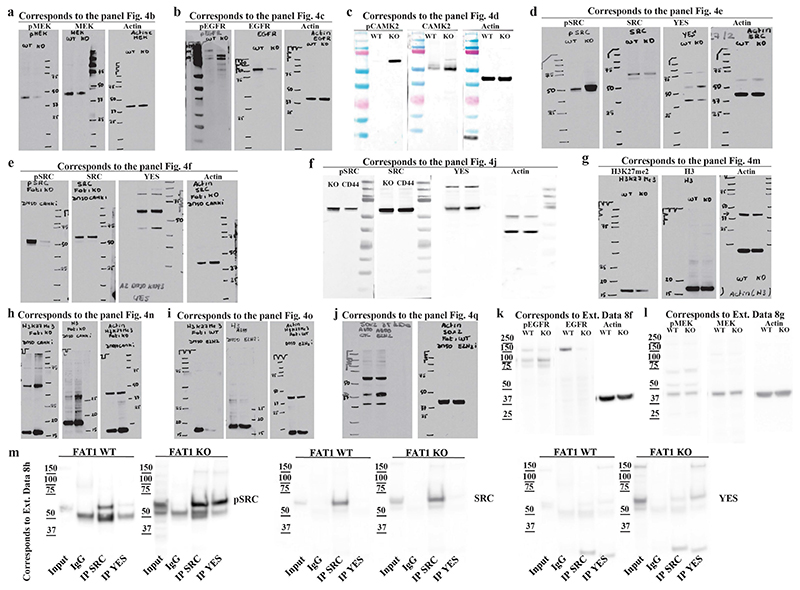
Extended Data Fig. 9. Full scan of western blot membranes.
a–k, Images showing full scan of western blot membranes displayed in Fig. 4. Each panel indicates the figure and the panel to which the full membrane image belongs. Molecular weight size standards are indicated on each membrane. In all the experiments the controls (β-actin) were run on the same gel as the samples.

