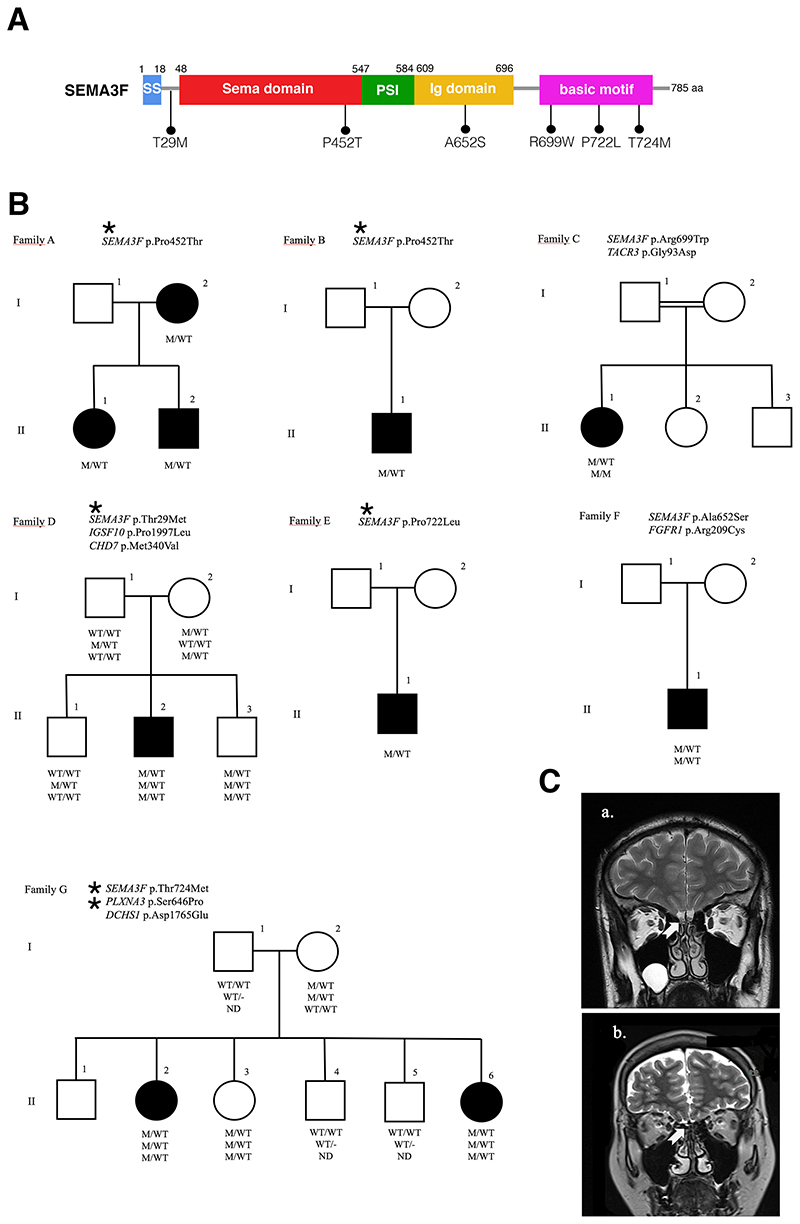
Figure 1. SEMA3F Mutations in the etiology of idiopathic hypogonadotropic hypogonadism.
A. The mutations are depicted on the functional gene diagram of SEMA3F. B. The pedigrees of seven families with SEMA3F mutations are shown. Affected males and females are represented by black squares and black circles respectively. White square symbols indicate unaffected male family members, white circle symbols represent unaffected female family members, and the double line indicates consanguinity. Under each symbol are the genotypes in the same order as the gene and variantdescriptions, with WT and M denoting wild type and mutant, respectively. ND: Not determined. C. The T2-weighted magnetic resonance imaging (MRI) from a healthy control (a) and from patient DII-2 (b). The arrows point to normal (a) and aplastic olfactory bulbs (b).

