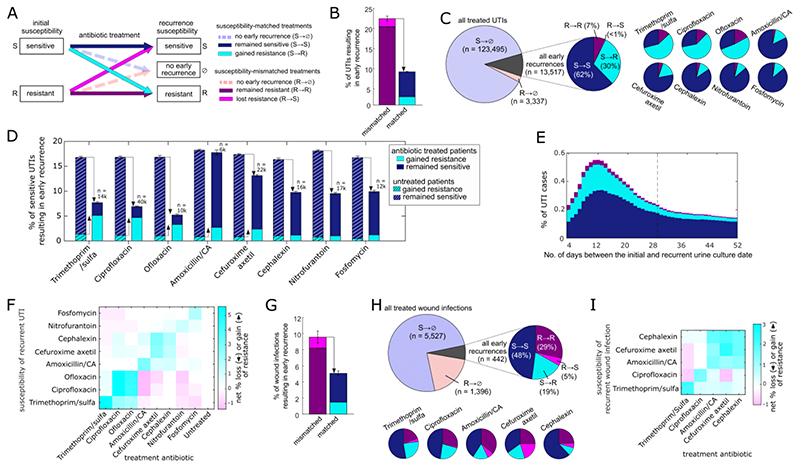
Figure 1. Post-treatment recurrences are strongly associated with the infection gaining resistance specifically to the treated antibiotic.
(A) Each infection case was categorized into one of six possible outcomes based on the susceptibility and treatment outcome. (B,G) The overall rate of recurrence for UTIs (B) and wound infections (G) following either susceptibility-matched or susceptibility-mismatched antibiotic treatments. (C,H) The percentage of all antibiotic treated UTIs (C) and wound infections (H) resulting in early recurrence, and a breakdown of these early recurrences by their pre- and post- treatment susceptibility to the treatment antibiotic, for all treated cases and for each of the most frequently prescribed antibiotics. (D) The rate of early recurrence for UTIs initially sensitive to the specific antibiotic and either treated with this antibiotic (solid bars) or untreated (hashed bars). The cases are further categorized based on whether they recurred still sensitive to the specified antibiotic (blue) or recurred while gaining resistance to it (cyan). Susceptibility-matched treatment decreases the overall risk of early recurrences (down-pointing arrow), yet increases the risk of recurrence with gained resistance (up-pointing arrows). (E) The rate of UTI recurrences occurring on each day following antibiotic treatment (7-day moving average). Each recurrent case is categorized by pre- and post- treatment susceptibility to the prescribed antibiotic as shown in panel A. The dashed vertical line shows the 28-day threshold used to define early recurrences. (F,I) The net change in susceptibility of early recurrent UTIs (F) and wound infections (I). For infections treated with each antibiotic (x-axis) or untreated (UTIs), the percentage of gain of resistance (cyan) minus loss of resistance (magenta) to each specified antibiotic is shown (y-axis).

