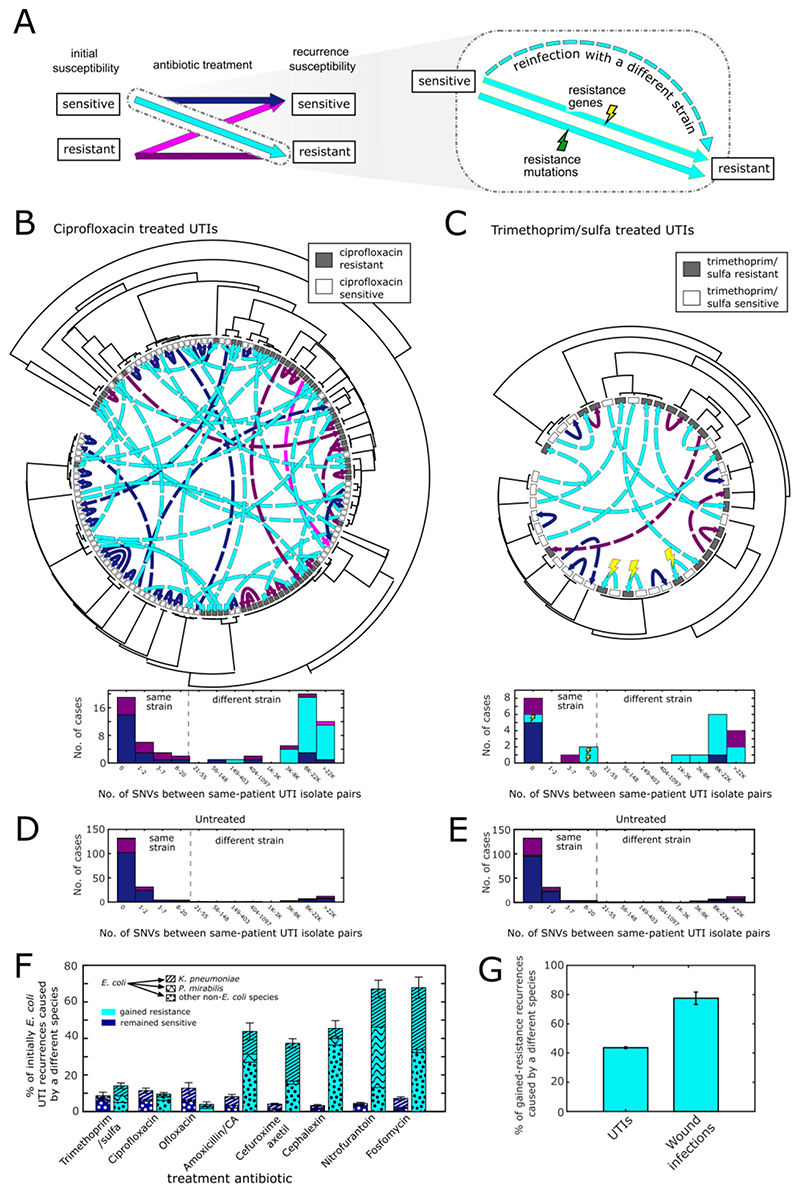
Figure. 2. Genomic analysis of infecting pathogens before and after antibiotic treatment.
(A) Infections which recurred with gained resistance following treatment (cyan) could be a consequence of acquiring resistance-conferring mutations (green lightning), resistance conferring genes (yellow lightning), or reinfection with a different strain resistant to the antibiotic (dashed arrow). (B,C) Phylogenetic trees of E. coli urine culture isolates collected from patients who experienced early recurrence following treatment with ciprofloxacin (B) or trimethoprim/sulfa (C), with isolate resistance/sensitivity to the prescribed antibiotic indicated by grey/white boxes. Same-patient isolates are connected with arrows whose color and style represent change in infection susceptibility and mechanism of gain of resistance (as defined in panel A). Histograms show the genetic distance, in number of single nucleotide variations (SNVs), between these same patient isolate pairs, again categorized by infection susceptibility and mechanism of gain of resistance (as defined in panel A). Vertical dashed lines represent the threshold used to define same-strain versus different-strain recurrences. (D,E) Histograms of the genetic distance in SNVs between same-patient isolates in untreated cases categorized by infection susceptibility to ciprofloxacin (D) or trimethoprim (E). (F) The percentage of E. coli infections treated with a susceptibility-matched antibiotic which resulted in early recurrence with different non-E. coli species (bar patterns), for recurrences which remained sensitive (blue) or gained resistance (cyan) to the prescribed antibiotic. (G) The percentage of gained-resistance recurrences in all UTIs and wound infections which were caused by reinfection with a different species.

