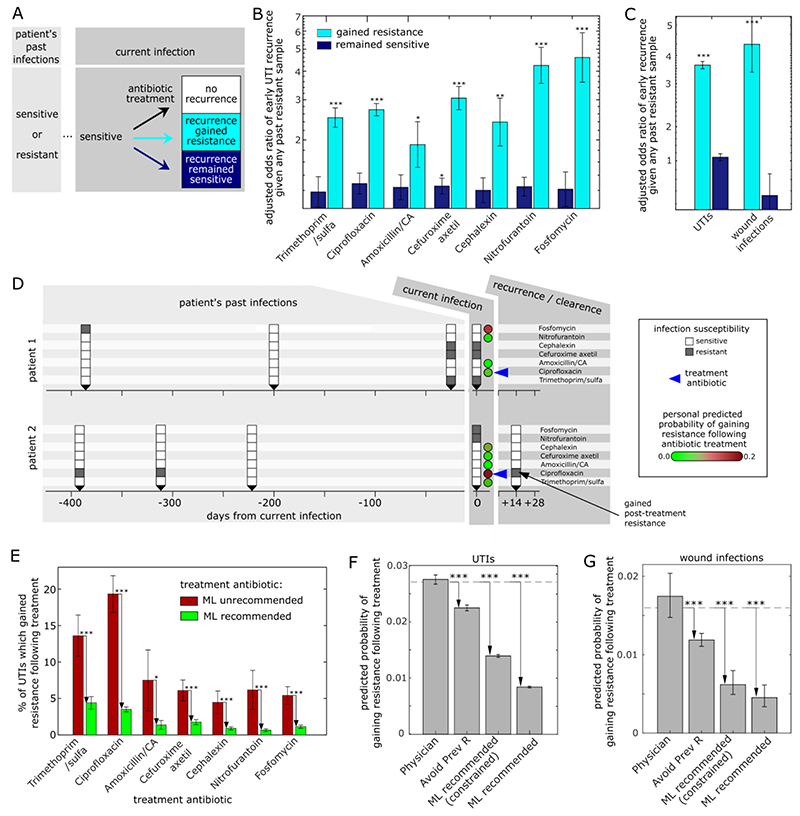
Figure 3. Personalized, antibiotic-specific, predictions of treatment-induced emergence of antibiotic resistance.
(A) Schematic showing the possible outcomes of susceptibility-matched antibiotic treatment for patients with a recorded history of prior infection susceptibility to the currently prescribed antibiotic. (B) Odds ratio of risk of early recurrence which gained resistance (cyan) or remained sensitive (blue) given the patient’s prior history of resistant infections (binary 1/0: any prior resistance to the prescribed antibiotic, or no prior resistance to the prescribed antibiotic). For each antibiotic, all susceptibility-matched treated cases for patients with any prior infections within the past 3 years are considered. Odds ratios are adjusted for demographics (age, gender) and potential risk factors (pregnancy, catheter use). (C) The adjusted odds ratio of early recurrence given the patient’s prior history of resistant infections for all antibiotic treatments combined for both UTIs and wound infections. (D) Timeline of two example patients showing, the susceptibilities of their current (t=0) and prior (t<0) infections for each antibiotic (white/grey for sensitive/resistance), as well as their ML predicted probability of recurrence with gained resistance upon treatment of their current infection with each of the antibiotics (circles, green-to-red colormap). Despite both patients treated with the same antibiotic for which their infection was sensitive, ciprofloxacin (blue arrow), they had very different ML personal predicted risk of gaining post-treatment ciprofloxacin resistance and indeed varied accordingly in the treatment outcome. (E) The percentage of UTIs within the 14-month test period which gained resistance following treatment for cases prescribed an antibiotic that was unrecommended (red, 15% highest predicted risk) or recommended (green, 85% lowest predicted risk) by the ML algorithm (these results are robust to choice of grouping intermediate level resistance with resistant, Fig. S16). (F,G) The overall predicted probability of gaining resistance for all UTIs (F) and wounds (G) during the test period for 4 different antibiotic prescription methods: the actual antibiotic prescribed by the physician; an algorithm that randomly chooses an antibiotic but avoids antibiotics to which the patient had past resistance, and the ML recommendation either unconstrained, or constrained such that each antibiotic is recommended at the exact same frequencies as prescribed by the physicians. The dashed line represents the actual gained-resistance rate for the physician-prescribed antibiotics during the test period. * p < 0.05; ** p < 0.005; *** p < 0.0005.

