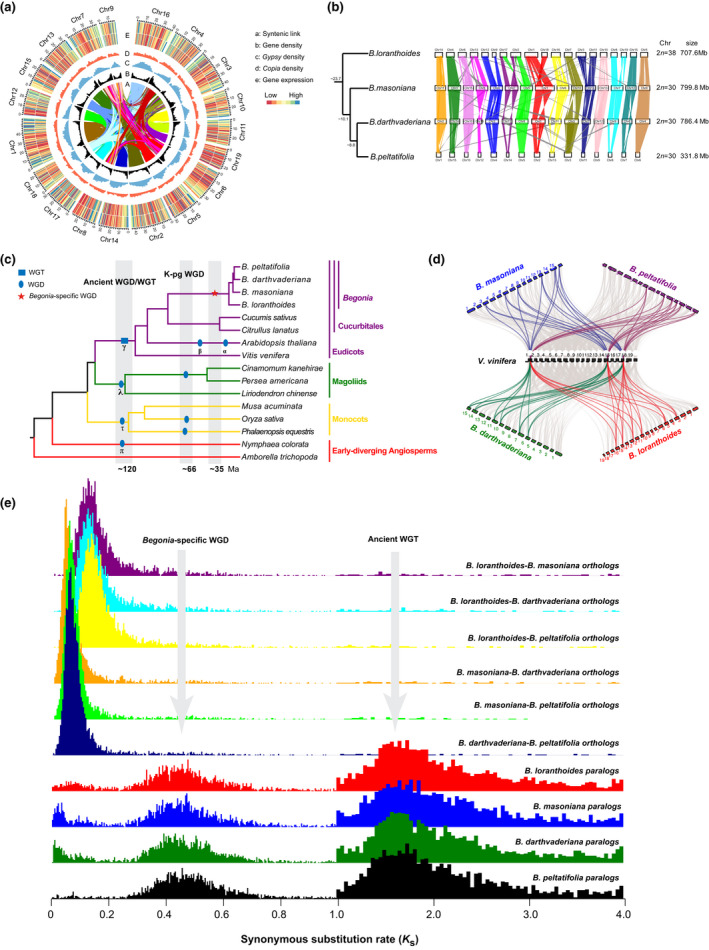
Fig. 2.

Synteny and lineage‐specific whole‐genome duplication (WGD) in Begonia. (a) Circular view of the Begonia loranthoides genome. a: Lines in the inner circle represent links between synteny‐selected paralogs. b: Gene density, c: Gypsy and d: Copia abundance, e: RNA expression of stem (outer) and leaf (inner). (b) Syntenic blocks in homologous chromosomes between B. loranthoides–B. masoniana, B. masoniana–B. darthvaderiana, and B. darthvaderiana–B. peltatifolia. (c) A simplified phylogenetic tree showing the lineage‐specific WGD in Begonia. The other generally accepted WGDs shown are based on Jiao et al. (2011) and Zhang et al. (2020). (d) Macrosynteny patterns show that three typical ancestral regions in the grape genome can be mapped to six regions in the Begonia genome. Gray wedges in the background highlight major syntenic blocks spanning > 30 genes between the genomes (highlighted by one syntenic set shown in color). (e) Synonymous substitution rate (Ks ) distributions of syntenic blocks for the paralogs of four Begonias and orthologs between either two Begonias are shown in different colors, as indicated. Note the Ks unit in the range 1.0–4.0 is ten‐fold of that in the range 0–1.0.
