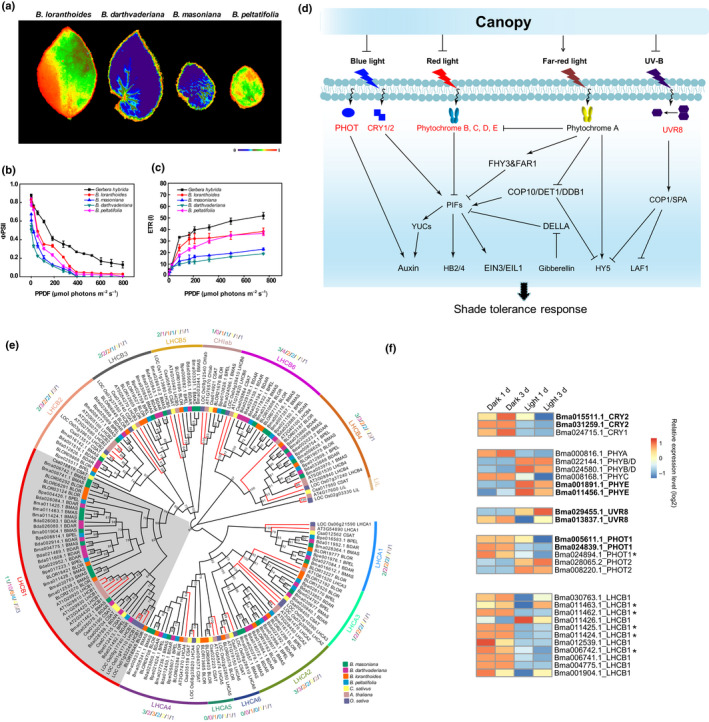
Fig. 4.

Shade adaptation in Begonia. (a) False‐color images representing maximum photochemical efficiency of PSII (F v/F m) under growth light conditions in four different Begonia species. The false‐color scale ranges from black (0) to red (1) as indicated below the false‐color images. Light‐response curves of PSII quantum yield (ΦPSII) (b) and electron transport rate of PSI (ETRI) (c) of four Begonias and Gerbera hybrida. Four biological replicates were performed in all experiments, and values are given as mean ± SD. (d) Simplified overview of the signal transduction pathway of shade adaptation response modified from Gommers et al. (2013) and Podolec & Ulm (2018). Arrows and blunt arrows indicate positive and negative regulations, respectively. The expansion genes in Begonia are labeled in red. Full names of gene abbreviations are given in Table S17. (e) Phylogenetic tree of light‐harvesting Chla/b‐binding protein (LHC) superfamily show expansion of LHCB in two shade Begonias. Branch of LHCB1 in gray shows prominent expansion. Numbers corresponding to different species are shown beside each subfamily. (f) Expression patterns of photoreceptors and LHCB1 family genes under light and dark treatment. The lineage‐specific whole‐genome duplication retained genes are labeled in bold, and genes marked by an asterisk are derived from tandem duplication.
