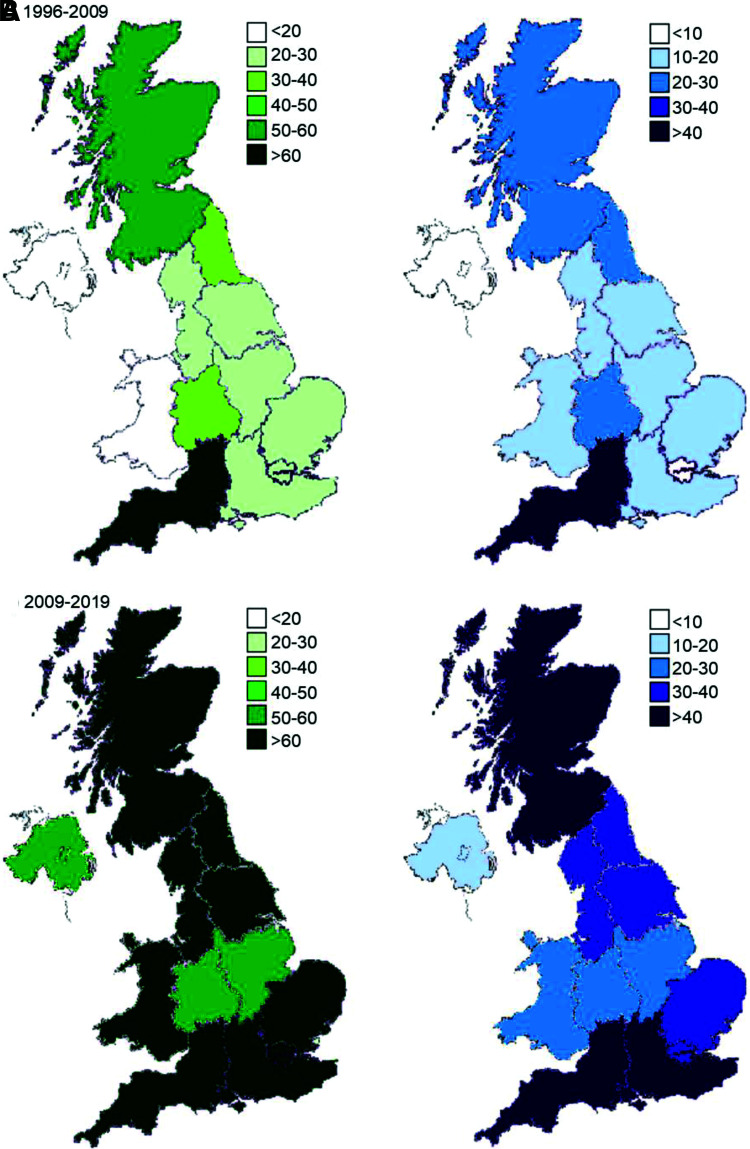
Figure 1.
Maps of the U.K. showing regional variations for referrals for MODY testing (per million population) (in green) and cases diagnosed with monogenic diabetes outside the neonatal period (per million population) (in blue) for 1996 to 28 February 2009 (A) and 1 March 2009 to 31 December 2019 (B). Same scale as in original 2010 study (8) used for both.

