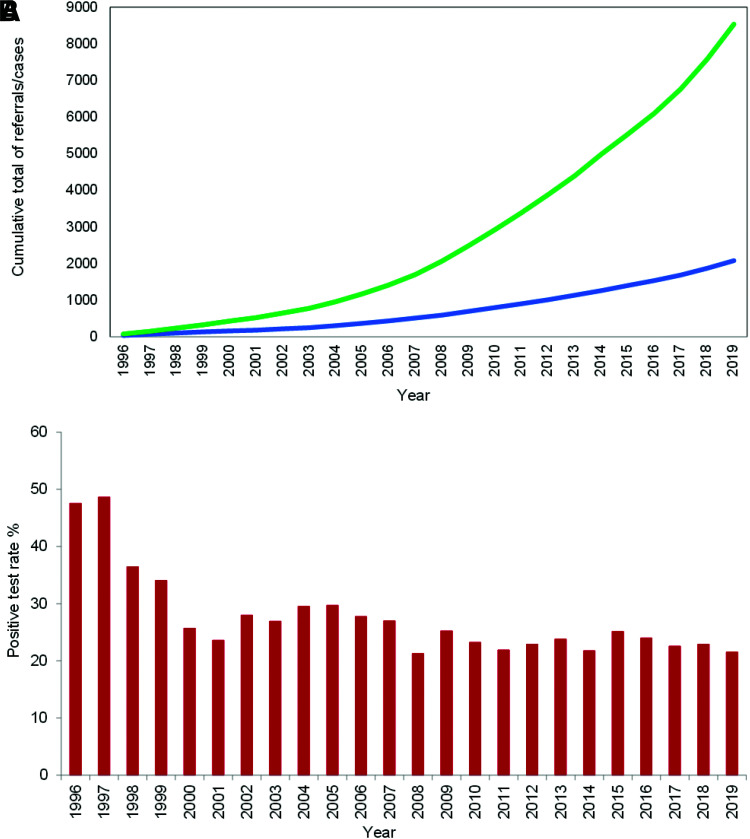
Figure 2.
A: Cumulative frequency of proband referrals (green) and proband cases (blue) of monogenic diabetes from 1996 to 2019 at the Exeter Genomics Laboratory. B: Yearly proband positive test rate of monogenic diabetes. Positive test rate was calculated as the proportion of positive cases of all referrals in that year.

